

HOT TOPICS LIST
- MACD
- Fibonacci
- RSI
- Gann
- ADXR
- Stochastics
- Volume
- Triangles
- Futures
- Cycles
- Volatility
- ZIGZAG
- MESA
- Retracement
- Aroon
INDICATORS LIST
LIST OF TOPICS
PRINT THIS ARTICLE
by Koos van der Merwe
This maxim is on everyone's lips at the moment. Is the market going into a quiet phase over the next few months because of the start of the summer holidays? Or is there something else involved?
Position: Sell
Koos van der Merwe
Has been a technical analyst since 1969, and has worked as a futures and options trader with First Financial Futures in Johannesburg, South Africa.
PRINT THIS ARTICLE
CYCLES
Sell In May And Go Away?
05/28/09 11:46:28 AMby Koos van der Merwe
This maxim is on everyone's lips at the moment. Is the market going into a quiet phase over the next few months because of the start of the summer holidays? Or is there something else involved?
Position: Sell
| With the start of June and the official start of summer on June 22, and of course the closing of schools, many traders do choose to sell in May, at the high, to enjoy the summer fishing, lying on the beach, cruising, and not have to worry about the market. Of course the odd newspaper is lying around, and the temptation to switch to CNBC once the kids are asleep is there, unless of course a good movie is on, which over summer is rare. So the market relaxes and gradually drifts down. For how long? When do bargains start catching our attention and the phone call to the broker become a must-do? |
|
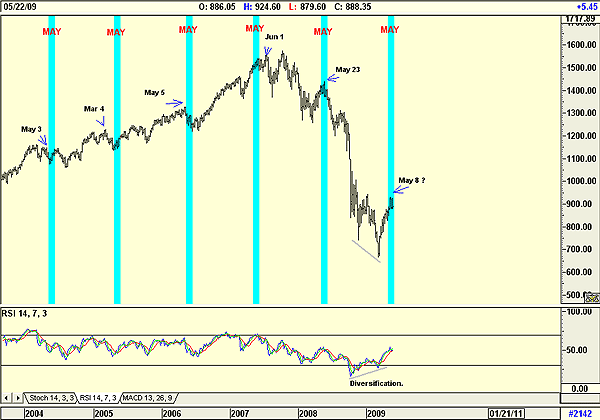
| FIGURE 1: S&P 500, WEEKLY. The S&P 500 shows movement over May. |
| Graphic provided by: AdvancedGET. |
| |
| Figure 1, a weekly chart of the Standard & Poor's 500, shows that although the "Sell in May" maxim does suggest a high in the market, sometimes that high can be in the first week of May, and on other times it can be in the first week of March or June. So as the chart shows, it is not quite the "Sell in May" we are familiar with, but it is close enough. So how far will the index fall? Do note two things on the chart besides the May cycle: 1. The recent recovery is a "V" formation, suggesting that a retracement is on the cards. 2. The relative strength index (RSI) gave a diversified buy signal, a higher high on the indicator to a lower low on the index. This suggests that any correction is a correction only in a major bull market. Many will shout as the index corrects that the bear market is back in force. When that happens, that is the time to look for bargains and buy. |
|
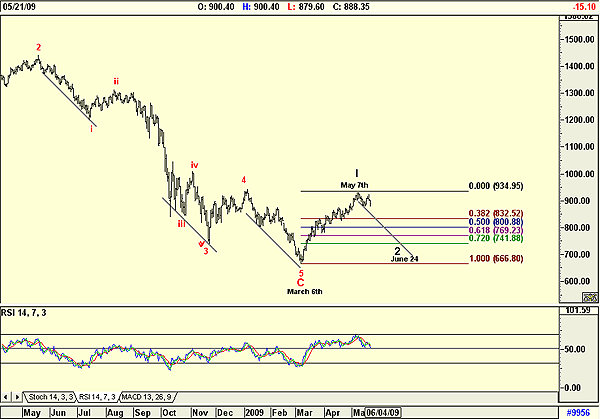
| FIGURE 2: S&P 500, DAILY. This chart of the S&P 500 suggests a bottom of a wave 2. |
| Graphic provided by: AdvancedGET. |
| |
| Figure 2 is a daily chart of the S&P 500. My wave count shows that a C-wave, the end of the bear market, has truly been completed, and suggests that the recent rise in the market is a wave 1 of a new bull market topping out on May 7. The chart shows the following: 1. The C-wave bottomed on March 6. 2. The RSI gave a buy signal on that date. 3. Fibonacci retracement from the low of March 6 to the high of May 7. This suggests various levels that the index could test. 4. Parallel trendlines suggest that a correction of 72%, the outside correction, will occur around about the end of June . 5. Finally, note how the RSI found the 50% level as both a resistance and support level. A decisive break below it will confirm the correction in the index. 6. Wave 2 should correct in an a-b-c correction -- "a' down, "b" up or sideways, and "c" down. History has shown that the maxim "Sell in May and go away" is one that should be taken seriously. Do enjoy the summer holidays, but also start reading the newspaper and watching your favorite business network sometime starting in July, looking for stocks that have been oversold, especially when the news shouts, "The bear is back!" For the next few months, though, do enjoy the sun, and above all, relax. |
Has been a technical analyst since 1969, and has worked as a futures and options trader with First Financial Futures in Johannesburg, South Africa.
| Address: | 3256 West 24th Ave |
| Vancouver, BC | |
| Phone # for sales: | 6042634214 |
| E-mail address: | petroosp@gmail.com |
Click here for more information about our publications!
Comments
Date:�05/28/09Rank:�1Comment:�

Request Information From Our Sponsors
- StockCharts.com, Inc.
- Candle Patterns
- Candlestick Charting Explained
- Intermarket Technical Analysis
- John Murphy on Chart Analysis
- John Murphy's Chart Pattern Recognition
- John Murphy's Market Message
- MurphyExplainsMarketAnalysis-Intermarket Analysis
- MurphyExplainsMarketAnalysis-Visual Analysis
- StockCharts.com
- Technical Analysis of the Financial Markets
- The Visual Investor
- VectorVest, Inc.
- Executive Premier Workshop
- One-Day Options Course
- OptionsPro
- Retirement Income Workshop
- Sure-Fire Trading Systems (VectorVest, Inc.)
- Trading as a Business Workshop
- VectorVest 7 EOD
- VectorVest 7 RealTime/IntraDay
- VectorVest AutoTester
- VectorVest Educational Services
- VectorVest OnLine
- VectorVest Options Analyzer
- VectorVest ProGraphics v6.0
- VectorVest ProTrader 7
- VectorVest RealTime Derby Tool
- VectorVest Simulator
- VectorVest Variator
- VectorVest Watchdog