HOT TOPICS LIST
- MACD
- Fibonacci
- RSI
- Gann
- ADXR
- Stochastics
- Volume
- Triangles
- Futures
- Cycles
- Volatility
- ZIGZAG
- MESA
- Retracement
- Aroon
INDICATORS LIST
LIST OF TOPICS
PRINT THIS ARTICLE
by Donald W. Pendergast, Jr.
No matter if a reversal in the S&P 500 was a fluke. Tracking the weakest stocks in this index may alert you to potential shorting opportunities.
Position: N/A
Donald W. Pendergast, Jr.
Donald W. Pendergast is a financial markets consultant who offers specialized services to stock brokers and high net worth individuals who seek a better bottom line for their portfolios.
PRINT THIS ARTICLE
REL. STR COMPARATIVE
First Energy Near Back Of Relative Strength Pack
05/27/09 10:38:37 AMby Donald W. Pendergast, Jr.
No matter if a reversal in the S&P 500 was a fluke. Tracking the weakest stocks in this index may alert you to potential shorting opportunities.
Position: N/A
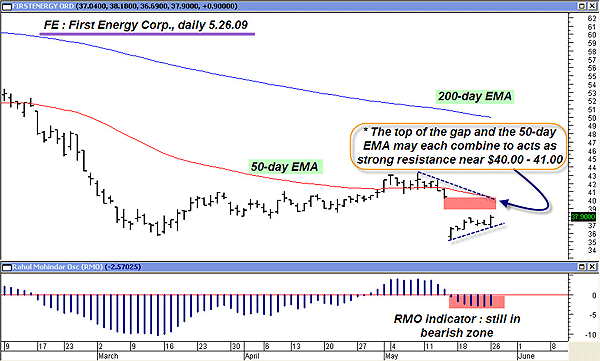
| First Energy (FE), based in Akron, OH, is one of the larger electric utility providers in the US, serving more than four million customers in Ohio, Pennsylvania, and New Jersey. Its common stock has been hit hard since last summer's high, plunging by nearly 60% in 10 months. FE ranks near the bottom of the Standard & Poor's 500 in terms of its long-term relative strength ranking, and the stock also features some interesting chart technicals that could make it an attractive short-sale candidate in the near future. |

|
| FIGURE 1: FE, DAILY. Putting this weak relative strength stock on your daily watchlist for potential short setups could be wise, given the significant number of resistance barriers that reside near the $40.25 level. |
| Graphic provided by: MetaStock. |
| |
| FE's daily chart says so much -- the downward-sloping blue line is the stock's 200-day exponential moving average (EMA). FE isn't as far below its 200-day EMA in percentage terms as it was in early March, but not much has changed to make this particular electric utility an attractive buy proposition. The stock hasn't even managed a series of sustained closes above its shorter-term 50-day EMA (red line), so it's clear that FE has a lot of work to do in order to recover some of its former price levels. Of particular note is the large open gap (formed on May 15, 2009; see Figure 1), the lower end of which also coincides with the stock's current 50-day EMA reading of approximately $40.25. Given the fact that FE's price momentum (depicted at the bottom of the chart by the Rahul Mohindar oscillator [RMO]) is still well below its zero line, the gist of this daily chart seems to suggest that FE may be due for a reversal lower as it approaches the barrier formed by the 50-day EMA and the top of the open gap. |

|
| FIGURE 2: WEAKEST LONG-TERM RELATIVE STRENGTH STOCKS, S&P 500. Here are the five weakest long-term relative strength stocks in the S&P 500 as of May 26, 2009. |
| Graphic provided by: MetaStock. |
| |
| Here we see just how weak FE has been, using a MetaSatock relative strength exploration based on the stock's three-, six-, and 12-month performance in percentage terms (Figure 2). Only General Motors (GM), Eastman Kodak (EK), Keycorp (KEY), and Lexmark International (LXK) rank lower in terms of relative strength. FE also ranks poorly in terms of earnings growth potential, a bit of fundamental information that could also be useful to know, should FE rise to resistance and then offer a confirmed sell signal. A stochRSI might be a good choice to help time a logical short entry at that point, should the sell setup materialize. |
| Putting FE on your daily watchlist seems to make sense; those of you who read my recent Traders.com Advantage article on the potential trend reversal setup under way in the S&P 500 already know that the odds favor a more lengthy corrective move lower in that index, so keeping an eye on both FE and the S&P 500 for confirmed reversals could be a potentially profitable way to invest your time. |
Donald W. Pendergast is a financial markets consultant who offers specialized services to stock brokers and high net worth individuals who seek a better bottom line for their portfolios.
| Title: | Writer, market consultant |
| Company: | Linear Trading Systems LLC |
| Jacksonville, FL 32217 | |
| Phone # for sales: | 904-239-9564 |
| E-mail address: | lineartradingsys@gmail.com |
Traders' Resource Links | |
| Linear Trading Systems LLC has not added any product or service information to TRADERS' RESOURCE. | |
Click here for more information about our publications!
Comments
Date: 05/27/09Rank: 5Comment:

Request Information From Our Sponsors
- StockCharts.com, Inc.
- Candle Patterns
- Candlestick Charting Explained
- Intermarket Technical Analysis
- John Murphy on Chart Analysis
- John Murphy's Chart Pattern Recognition
- John Murphy's Market Message
- MurphyExplainsMarketAnalysis-Intermarket Analysis
- MurphyExplainsMarketAnalysis-Visual Analysis
- StockCharts.com
- Technical Analysis of the Financial Markets
- The Visual Investor
- VectorVest, Inc.
- Executive Premier Workshop
- One-Day Options Course
- OptionsPro
- Retirement Income Workshop
- Sure-Fire Trading Systems (VectorVest, Inc.)
- Trading as a Business Workshop
- VectorVest 7 EOD
- VectorVest 7 RealTime/IntraDay
- VectorVest AutoTester
- VectorVest Educational Services
- VectorVest OnLine
- VectorVest Options Analyzer
- VectorVest ProGraphics v6.0
- VectorVest ProTrader 7
- VectorVest RealTime Derby Tool
- VectorVest Simulator
- VectorVest Variator
- VectorVest Watchdog
