HOT TOPICS LIST
- MACD
- Fibonacci
- RSI
- Gann
- ADXR
- Stochastics
- Volume
- Triangles
- Futures
- Cycles
- Volatility
- ZIGZAG
- MESA
- Retracement
- Aroon
INDICATORS LIST
LIST OF TOPICS
PRINT THIS ARTICLE
by Donald W. Pendergast, Jr.
Many industry groups are manifesting rising monthly price cycles, implying that more gains may be seen after a period of further correction and/or consolidation in the US markets.
Position: Accumulate
Donald W. Pendergast, Jr.
Donald W. Pendergast is a financial markets consultant who offers specialized services to stock brokers and high net worth individuals who seek a better bottom line for their portfolios.
PRINT THIS ARTICLE
CYCLES
Monthly Price Cycles Show Bullish Signs Of Life
05/27/09 10:00:56 AMby Donald W. Pendergast, Jr.
Many industry groups are manifesting rising monthly price cycles, implying that more gains may be seen after a period of further correction and/or consolidation in the US markets.
Position: Accumulate
| Running MetaStock's Explorer can make screening for trade setups a simple, efficient, and potentially profitable use of a trader's time. For example, if you want to know how many industry groups are above or below a 200-day moving average, you can get the answer in a matter of seconds; right now, however, let's try to get a long-term view of the markets through a basic analysis of monthly price cycles as determined by a particularly useful technical indicator, the WB DBS 10 oscillator, found in the ProfitTrader EOD add-on software for MetaStock. |

|
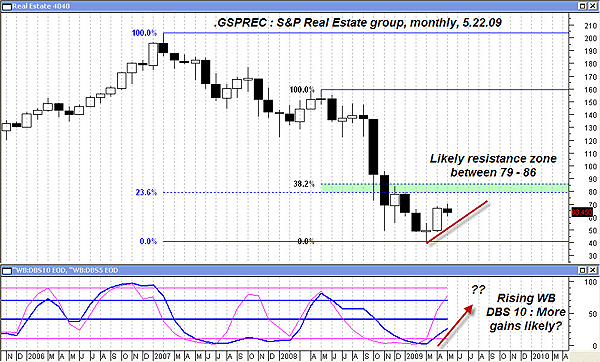
| FIGURE 1: GSPREC, MONTHLY. Based on past cyclical action, a move up to 78-86 in this index isn't out of the question. |
| Graphic provided by: MetaStock. |
| Graphic provided by: WB indicators from Profit Trader for MetaStock. |
| |
| Even though the broad US markets appear to have hit a daily-based top of some degree, a look at longer-term price cycles indicates that the current mild selloff (once it fully plays out) may actually offer more attractive buying opportunities in the weeks and months to come. Plugging in the Sectors and Industries S&P industry group list into the WB:DBS rising exploration (set to monthly) reveals that more than 90% of the Standard & Poor's 500 sectors and/or industry groups (92 out of 99) feature a rising monthly price cycle. Obviously, the broad US markets are still in bear market territory, but since many of those 92 sectors/industries have plenty of room for further gains (as measured by typical monthly cycle oscillations), it would pay to keep a close eye on the daily and weekly price action of these groups, looking for suitable long entry signals after a proportional pullback to various trend support levels such as a 50-period exponential moving average (EMA) and/or prior swing lows/highs, and so on. One industry group that looks interesting is the S&P Real Estate (RE) group (Figure 1). Like most other groups, it was hurt in the 2007–09 market rout, but now appears to have put in a major monthly low. While this group has a ton of overhead supply to work through, that rising WB DBS 10 indicator (blue line at the bottom of the chart) is the real key to the probable future direction of prices for the stocks in this hard-hit group. This index, which features such notable real estate stocks as CB Richard Ellis (CBG), Equity Residential (EQR), and Simon Property Group (SPG) (Figure 2), has significant overhead resistance between the 79-86 area, meaning that there is a fairly good probability that the rising price cycle can get fairly close to the lower end of that resistance barrier before its strength begins to fade. Let's have a look at one of the above-mentioned stocks (SPG) to see how it compares to its parent index on a monthly basis and then see if we can identify a few ways to play this stock, should we get a decent daily or weekly pullback. |

|
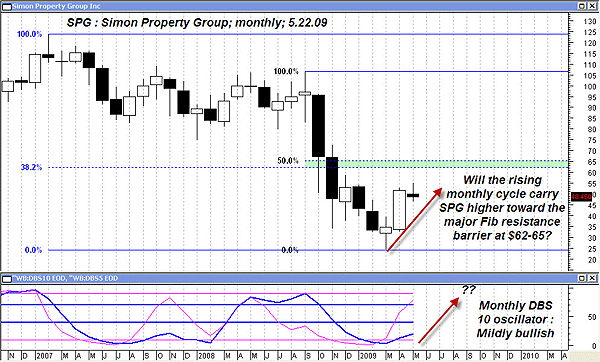
| FIGURE 2: SPG, MONTHLY. SPG is outperforming its S&P industry group (.GSPREC) and also has room to run based on a combination of Fibonacci resistance and current monthly cyclical action. Note the range of the April 2009 monthly candle compared to that of the March 2009 reversal candle. |
| Graphic provided by: MetaStock. |
| Graphic provided by: WB indicators from Profit Trader for MetaStock. |
| |
| SPG also has a rising monthly price cycle, and since the next significant Fibonacci resistance barrier doesn't appear until $62.00-65.00, SPG (currently at $48.45) might be an excellent long stock trade if it pulls back by another 10-15% on its daily chart. In addition, right now it could also be a fairly low-risk covered call trade, one designed to allow the rising monthly price cycle to pull it higher. Selling an at-the-money (ATM) October 2009 $48 call against every 100 shares of SPG will allow you to collect a very healthy premium of about $8.15 ($815), not too bad for an option that only has 144 days left til expiration. Selling this ATM call against your SPG stock position can provide you with a substantial amount of staying power, even if the stock pulls back more along with the broad market. Even better, SPG pays a 5% dividend (currently in the form of 80% stock and 20% cash), so those who sell this October call will also be entitled to at least one quarterly dividend payment. If the stock rises, the option's delta will accelerate but not as quickly as the price of the stock, which is good to know for those who might be inclined to cash in such a covered call trade prior to expiration. |
| What if the stock really starts another major leg down, especially after putting on a covered call trade here? No big deal, really; for this particular trade, consider closing it out on a weekly close below $40, unless you're a major believer in the potential for a commercial real estate turnaround over the next year or two. The 5% dividend provides some extra cushion against a major decline, but dividends can always be cut without warning. Meanwhile, daily based traders would do well to monitor all real estate-related ETFs and indexes, looking for suitable long entry areas if the current broad market selloff starts to level off. |
Donald W. Pendergast is a financial markets consultant who offers specialized services to stock brokers and high net worth individuals who seek a better bottom line for their portfolios.
| Title: | Writer, market consultant |
| Company: | Linear Trading Systems LLC |
| Jacksonville, FL 32217 | |
| Phone # for sales: | 904-239-9564 |
| E-mail address: | lineartradingsys@gmail.com |
Traders' Resource Links | |
| Linear Trading Systems LLC has not added any product or service information to TRADERS' RESOURCE. | |
Click here for more information about our publications!
Comments
Date: 05/27/09Rank: 4Comment:

Request Information From Our Sponsors
- VectorVest, Inc.
- Executive Premier Workshop
- One-Day Options Course
- OptionsPro
- Retirement Income Workshop
- Sure-Fire Trading Systems (VectorVest, Inc.)
- Trading as a Business Workshop
- VectorVest 7 EOD
- VectorVest 7 RealTime/IntraDay
- VectorVest AutoTester
- VectorVest Educational Services
- VectorVest OnLine
- VectorVest Options Analyzer
- VectorVest ProGraphics v6.0
- VectorVest ProTrader 7
- VectorVest RealTime Derby Tool
- VectorVest Simulator
- VectorVest Variator
- VectorVest Watchdog
- StockCharts.com, Inc.
- Candle Patterns
- Candlestick Charting Explained
- Intermarket Technical Analysis
- John Murphy on Chart Analysis
- John Murphy's Chart Pattern Recognition
- John Murphy's Market Message
- MurphyExplainsMarketAnalysis-Intermarket Analysis
- MurphyExplainsMarketAnalysis-Visual Analysis
- StockCharts.com
- Technical Analysis of the Financial Markets
- The Visual Investor
