HOT TOPICS LIST
- MACD
- Fibonacci
- RSI
- Gann
- ADXR
- Stochastics
- Volume
- Triangles
- Futures
- Cycles
- Volatility
- ZIGZAG
- MESA
- Retracement
- Aroon
INDICATORS LIST
LIST OF TOPICS
PRINT THIS ARTICLE
by Donald W. Pendergast, Jr.
All trends eventually slow down, then consolidate and/or reverse direction; right now, the Standard & Poor's 500 appears to be on the verge of such a trend reversal.
Position: N/A
Donald W. Pendergast, Jr.
Donald W. Pendergast is a financial markets consultant who offers specialized services to stock brokers and high net worth individuals who seek a better bottom line for their portfolios.
PRINT THIS ARTICLE
REVERSAL
SPX Slowing Momentum And Potential Trend Reversal
05/22/09 09:06:45 AMby Donald W. Pendergast, Jr.
All trends eventually slow down, then consolidate and/or reverse direction; right now, the Standard & Poor's 500 appears to be on the verge of such a trend reversal.
Position: N/A
| The recent bear market rally in the broad US stock indexes has been impressive; the S&P 500 (.SPX) rose by 39.50% from the March 6, 2009, low of 666.79 to the intraday high of 930.17, achieved on May 8, 2009. And yes, this has been a bear market rally, given the fact that the monthly S&P 500 is still well below its downward-sloping 12-period simple moving average (SMA). What might the next few weeks and/or months hold in store for this vital index, one that sets the pace for much of the trading activity among professional and institutional traders? |

|
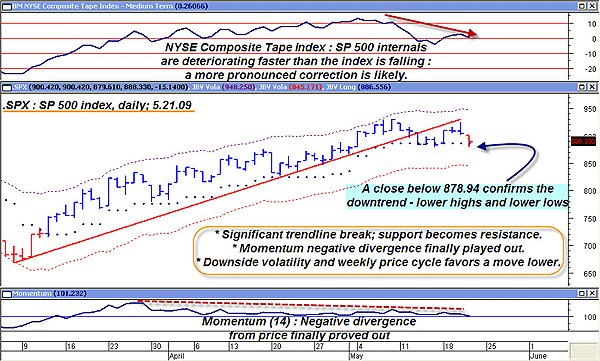
| FIGURE 1: SPX, DAILY. A trendline break and reversal, declining momentum, and weakening internal strength measures all combine to suggest that the S&P 500 is likely to move lower in the weeks ahead. |
| Graphic provided by: MetaStock. |
| Graphic provided by: JBV expert advisor for Metastock v 10.1. |
| |
| The technical cues available on the .SPX are fairly basic, but enough is visible here to conclude that the most likely direction for the index is down, at least for the next few weeks, especially if the May 15, 2009, low of 878.94 is taken out on a daily close (Figure 1). That particular swing low is so important because a daily close below it will confirm the existence of a defacto downtrend -- a series of lower highs and lower lows -- even as the index's internal strength readings (top of chart; it's a weighted mix of the advance/decline line, new highs/new lows, up volume/down volume and the rate of change of the index's daily closing prices) continue to deteriorate at a faster clip than that of the S&P 500 itself. Even more telling is the significant long-term trendline break; after busting below the major support implied by the line, prices staged a feeble rally, only to be turned back lower as the trendline acted as resistance. Finally, at the bottom of the chart, witness the momentum (14) indicator, which had been warning of a progressively more pronounced negative price-momentum divergence, a divergence that ultimately proved out with the trendline break and reversal move in the index. Let's move to the monthly S&P 500 chart to get a better idea of what might happen next in this major index. |

|
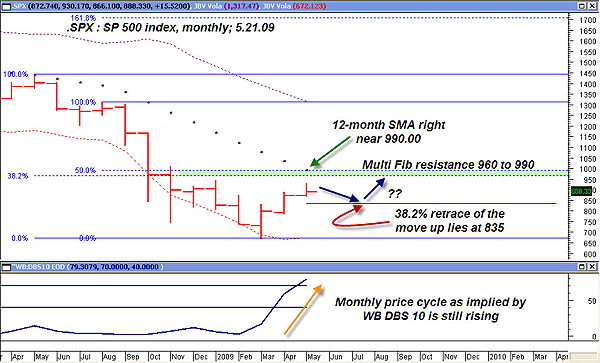
| FIGURE 2: SPX, MONTHLY. Formidable resistance exists in the range spanning 960 to 990; in the near term, however, Fibonacci 38.2% support near 835 may be the next logical support target. |
| Graphic provided by: MetaStock. |
| Graphic provided by: JB Volatility Expert Advisor and ProfitTrader Ind. |
| |
| The monthly chart (Figure 2) gives us a more panoramic view of the lay of the land; clearly, the S&P 500 has a great deal of overhead resistance to cast aside if it hopes to escape the bloody paws of the great bear. The dotted line represents the 12-month SMA, one of the best ways to distinguish between a bear and bull market phases -- if the index is below the 12-month SMA and the SMA slope is down, you're in a bear market. Conversely, if the index is above the 12-month SMA and the SMA slope is up, you're in a bull market. With a current 12-month SMA reading of 990 (and with a downward slope, no less), the S&P 500 is still firmly ensconced in a primary trend bear market, even with the strong rally up from the March 2009 lows. Coinciding with the 990 reading on the SMA, we also learn that there is a strong Fibonacci retracement confluence zone (formed by a 50% retracement of one major swing and a 38.2% retracement or a higher degree swing), spanning the range from 960 to 990. More likely than not, the 960 to 990 zone is going to present a formidable resistance barrier for the S&P 500 at some point in the future. Meanwhile, the weekly price cycle (not shown) has turned decisively lower, and given the heavily bearish technical confirmations of the daily chart, it leads to the conclusion that the S&P 500's next stopping point may coincide with the 38.2% retracement of the March to May bear rally, which happens to reside near 835. If 835 holds and the S&P 500 can reverse higher, the odds are good that another rally could take root, propelling the index higher for a shot at challenging those aforementioned resistance areas of 960 to 990. |
| Bottom line: look for the S&P 500 and most other US stock indexes to drift lower over the next couple of months, seeking to establish solid support in the wake of an anticipated higher low. As always, traders who track the strongest and weakest relative strength sectors and industry groups should be able to locate plenty of attractive trading opportunities, no matter what the major stock indexes are doing. |
Donald W. Pendergast is a financial markets consultant who offers specialized services to stock brokers and high net worth individuals who seek a better bottom line for their portfolios.
| Title: | Writer, market consultant |
| Company: | Linear Trading Systems LLC |
| Jacksonville, FL 32217 | |
| Phone # for sales: | 904-239-9564 |
| E-mail address: | lineartradingsys@gmail.com |
Traders' Resource Links | |
| Linear Trading Systems LLC has not added any product or service information to TRADERS' RESOURCE. | |
Click here for more information about our publications!
Comments
Date: 05/22/09Rank: 5Comment:

Request Information From Our Sponsors
- StockCharts.com, Inc.
- Candle Patterns
- Candlestick Charting Explained
- Intermarket Technical Analysis
- John Murphy on Chart Analysis
- John Murphy's Chart Pattern Recognition
- John Murphy's Market Message
- MurphyExplainsMarketAnalysis-Intermarket Analysis
- MurphyExplainsMarketAnalysis-Visual Analysis
- StockCharts.com
- Technical Analysis of the Financial Markets
- The Visual Investor
- VectorVest, Inc.
- Executive Premier Workshop
- One-Day Options Course
- OptionsPro
- Retirement Income Workshop
- Sure-Fire Trading Systems (VectorVest, Inc.)
- Trading as a Business Workshop
- VectorVest 7 EOD
- VectorVest 7 RealTime/IntraDay
- VectorVest AutoTester
- VectorVest Educational Services
- VectorVest OnLine
- VectorVest Options Analyzer
- VectorVest ProGraphics v6.0
- VectorVest ProTrader 7
- VectorVest RealTime Derby Tool
- VectorVest Simulator
- VectorVest Variator
- VectorVest Watchdog
