HOT TOPICS LIST
- MACD
- Fibonacci
- RSI
- Gann
- ADXR
- Stochastics
- Volume
- Triangles
- Futures
- Cycles
- Volatility
- ZIGZAG
- MESA
- Retracement
- Aroon
INDICATORS LIST
LIST OF TOPICS
PRINT THIS ARTICLE
by Donald W. Pendergast, Jr.
Solid earnings growth and a rising weekly price cycle implies further gains for this group of 11 gold mining stocks.
Position: N/A
Donald W. Pendergast, Jr.
Donald W. Pendergast is a financial markets consultant who offers specialized services to stock brokers and high net worth individuals who seek a better bottom line for their portfolios.
PRINT THIS ARTICLE
CYCLES
Solid Earnings Growth Driving Gold Miners Higher
05/20/09 08:43:56 AMby Donald W. Pendergast, Jr.
Solid earnings growth and a rising weekly price cycle implies further gains for this group of 11 gold mining stocks.
Position: N/A
| Gold bullion prices keep grinding higher, though maybe not as quickly as some in the gold bug camp might have hoped for. At times it seems that the old rules that once governed the world of investing have been cast aside, making the financial markets a more menacing and formidable adversary than in times past. Nonetheless, gold has certainly remained the best-performing commodity asset since 2001, and that by a wide margin. Even better, when the stocks of gold mining companies begin to catch a bid, they tend to outperform gold itself during certain market phases. This article will focus on a custom index of 11 gold mining stocks with well above-average long-term earnings prospects, and will attempt to ascertain if these particular stocks still have some more room for further gains — or not. |

|
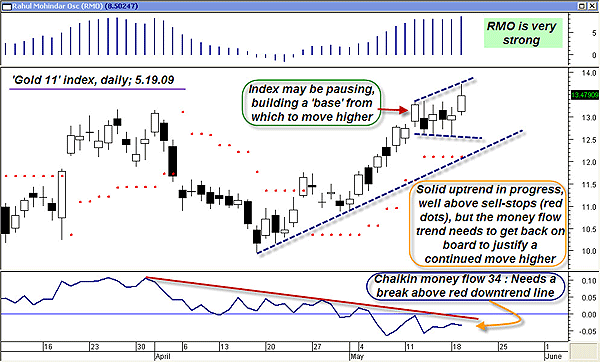
| FIGURE 1: GOLD 11, DAILY. While the overall trend dynamics on this daily graph are very bullish, unless the money flow indicator (bottom of chart) gets back in line, the future of this uptrend is uncertain. |
| Graphic provided by: MetaStock. |
| Graphic provided by: Rahul Mohindar oscillator (RMO) from MetaStock v 1. |
| |
| Taking the time to do a bit of fundamental research, I ran a group of 25 gold mining equities (a mix of "juniors" and "seniors," as the gold bugs like to refer to them) through a stock screener, one designed to isolate those stocks with the best earnings growth rates (along with a few other vital financial stats like the price to sales ratio, and so on). Here are the tickers for the 11 stocks that made the earnings cut: ANV, GFI, GG, GOLD, GRS, GRZ, HMY, NAK, NXG, TRE, WGW Four of the stocks are major producers (GFI, GG, GOLD, and HMY), while the balance is a mix of more speculative "juniors." All appear to be on track to increase their earnings for the next 12 to 18 months, however, and given the hugely inflationary "leaven" that the fiscal bailout bunch have baked into the global economic cake, it seems like a fairly safe bet that the majority of these stocks will outperform not only the broad market indexes but also of the price of gold itself. Using a special add-on made specifically for MetaStock, I then created an equal-weight index for the 11 stocks, nicknaming it the "Gold 11" index. This index has actually outperformed the more widely known Gold Bugs index (.HUI) by about 20% since November 2008, most likely due to the superior mix (based on long-term earnings growth) of stocks contained within. The Gold 11 daily chart (Figure 1) depicts a mixed technical picture for the moment; first of all, the rising trendline confirms the overall bullishness of the index, a fact also verified by the extremely strong Rahul Mohindar oscillator (RMO) at the top of the chart. The Gold 11 is also well above its sell-stop line (red dots on chart, set as a 2 *ATR 10 trailing volatility stop), another positive sign. On the negative side of the equation, the declining trendline of the Chaikin money flow (CMF)(34) indicator suggests that this daily trend move may remain in some sort of a consolidation phase unless it breaks sharply above that CMF downtrend line. It's also possible that the Gold 11 is simply hashing out a new base or platform from which to launch yet another move higher, a real possibility especially when viewed in the light of the outstanding technical factors present on the Gold 11 weekly chart, which is up next (Figure 2). |

|
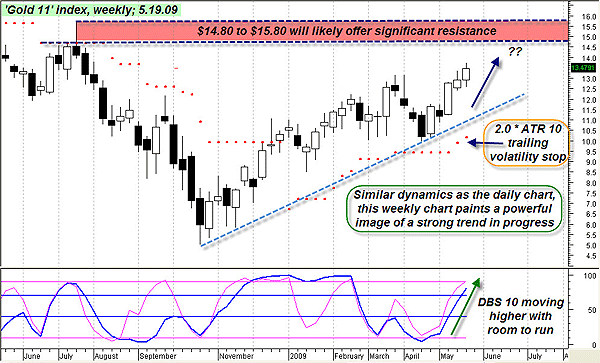
| FIGURE 2: GOLD 11, WEEKLY. Looking at a longer-term chart, the Gold 11 index takes on an even more bullish tone. Note how the DBS 10 indicator (blue line at bottom of chart) is rising at a very high angle of attack in the wake of a significant reversal, one that established a major uptrend line. |
| Graphic provided by: MetaStock. |
| Graphic provided by: Various indicators from ProfitTrader for MetaStock. |
| |
| Viewing the Gold 11 daily trend in light of this mega, multimonth trend move on the weekly chart is sure to rekindle the bullish flame in many a lukewarm gold bug, given that this particular graph has so much going for it. Just as on the daily chart, the most prominent technical feature is the beautiful long-term uptrend line, a powerful technical trend delineator that's eight months old and shows no sign of weakness at all. More meaningful is the WB DBS 10 indicator (blue line at bottom of the chart), an indicator that has a high degree of accuracy in calling the cyclical turns in most freely traded markets. Generally speaking, when this indicator crosses above its lower signal line (horizontal blue bar), there is a 70% to 80% chance that the indicator will carry all the way to the upper signal line, just as it did at the last major weekly cycle low in October 2008. In fact, this index gained a full two points from November 28, 2008, through January 2, 2009, launching higher from an indicator level (currently at 81) that was identical to today's reading. Clearly, the term "overbought" must be used with great discretion, particularly when analyzing oscillating-type indicators on a stock or index that's entering into or is currently enmeshed within a powerful trend move higher. Therefore, it appears reasonable to expect the Gold 11 index to continue to follow the weekly cycle higher, possibly all the way up to the red-shaded resistance zone found between $14.80 and $15.80. |
| Playing an index like this could be tough; after all, it isn't traded on any stock exchange, but here are a couple of ideas on how to put this knowledge to work for you: Using MetaStock's chart overlay feature, you can determine which of the 11 stocks most closely follows the Gold 11 index; it turns out that Goldcorp (GG) seems to track every swing and reversal move with a high degree of precision. Harmony Gold Mining (HMY) and Randgold (GOLD) also track the index very closely. Given that all three of these large-cap gold miners offer attractive bid-ask spreads on their equity options, let's examine a covered call play, one intended to take advantage of that beautiful rising weekly cycle indicator. |
| One attractive at the money (ATM) covered call play is as follows: Buy 100 shares of Goldcorp (GG) currently @ $34.19/share Sell 1 July 2009 Goldcorp $34.00 call option currently @ $2.75 ----------------------------------------------------------- Net debit, before commissions: $31.39 If called away at expiration 58 days from now, this trade will earn about $261; that's an annual rate of return of better than 46%. To manage the trade, simply create your own Gold 11 index in your own charting platform and close out the GG covered call position if either the weekly Gold 11 up trendline and/or ATR trailing volatility stop are violated on a weekly close. You can also create a weekly chart of GG similar to the one I created for Gold 11, managing the trade in exactly the same way. The risk to reward ratio looks very good for this kind of ATM covered call setup, given the strongly rising weekly price cycle in the Gold 11 index and Goldcorp shares, too. Even better, a trade setup like this doesn't require razor-sharp entry precision like a short-term swing trade. Letting the power of a strong long-term trend carry the position (hopefully) higher takes a lot of the daily stress away from the business of trading. Why not try to locate similar weekly cyclical trend setups in all of the stocks you normally follow? |
Donald W. Pendergast is a financial markets consultant who offers specialized services to stock brokers and high net worth individuals who seek a better bottom line for their portfolios.
| Title: | Writer, market consultant |
| Company: | Linear Trading Systems LLC |
| Jacksonville, FL 32217 | |
| Phone # for sales: | 904-239-9564 |
| E-mail address: | lineartradingsys@gmail.com |
Traders' Resource Links | |
| Linear Trading Systems LLC has not added any product or service information to TRADERS' RESOURCE. | |
Click here for more information about our publications!
Comments
Date: 05/21/09Rank: 3Comment:

Request Information From Our Sponsors
- StockCharts.com, Inc.
- Candle Patterns
- Candlestick Charting Explained
- Intermarket Technical Analysis
- John Murphy on Chart Analysis
- John Murphy's Chart Pattern Recognition
- John Murphy's Market Message
- MurphyExplainsMarketAnalysis-Intermarket Analysis
- MurphyExplainsMarketAnalysis-Visual Analysis
- StockCharts.com
- Technical Analysis of the Financial Markets
- The Visual Investor
- VectorVest, Inc.
- Executive Premier Workshop
- One-Day Options Course
- OptionsPro
- Retirement Income Workshop
- Sure-Fire Trading Systems (VectorVest, Inc.)
- Trading as a Business Workshop
- VectorVest 7 EOD
- VectorVest 7 RealTime/IntraDay
- VectorVest AutoTester
- VectorVest Educational Services
- VectorVest OnLine
- VectorVest Options Analyzer
- VectorVest ProGraphics v6.0
- VectorVest ProTrader 7
- VectorVest RealTime Derby Tool
- VectorVest Simulator
- VectorVest Variator
- VectorVest Watchdog
