HOT TOPICS LIST
- MACD
- Fibonacci
- RSI
- Gann
- ADXR
- Stochastics
- Volume
- Triangles
- Futures
- Cycles
- Volatility
- ZIGZAG
- MESA
- Retracement
- Aroon
INDICATORS LIST
LIST OF TOPICS
PRINT THIS ARTICLE
by Koos van der Merwe
Previously, I wrote suggesting a high-risk purchase of Royal Bank of Scotland Preferred ADRs as a high-yield investment. Here's another preferred share to look at that is also paying a yield of about 15%.
Position: Accumulate
Koos van der Merwe
Has been a technical analyst since 1969, and has worked as a futures and options trader with First Financial Futures in Johannesburg, South Africa.
PRINT THIS ARTICLE
OSCILLATORS
Buying For A Risky Yield, Part 2
05/20/09 08:29:16 AMby Koos van der Merwe
Previously, I wrote suggesting a high-risk purchase of Royal Bank of Scotland Preferred ADRs as a high-yield investment. Here's another preferred share to look at that is also paying a yield of about 15%.
Position: Accumulate
| In October 2007, ABN Amro was purchased by the Royal Bank of Scotland at a ridiculously high price in a consortium with Fortris and Santander Bank. This purchase eventually led to ABN Amro's collapse and nationalization. Almost exactly a year later, on October 3, 2008, the Dutch state announced that it had bought Fortis Bank Nederland, including its interests in ABN Amro. As of December 24, 2008, the Dutch state replaced Fortis as a stakeholder in RFS Holdings, which continues to manage ABN Amro. ABN Amro is now owned by RBS, Santander, and the Dutch government, and has branches and trades all over the world. There are branches in Africa, Asia, Australia and New Zealand, Europe, North America, and South America. However, with the financial world in disarray, ABN's various businesses around the globe are currently being separated from ABN Amro itself and integrated in line with each owner's plans. As the bank is restructured, its preferred share price has risen from a low of $2.06 on March 6, 2009, to its present level of $10.35. |

|
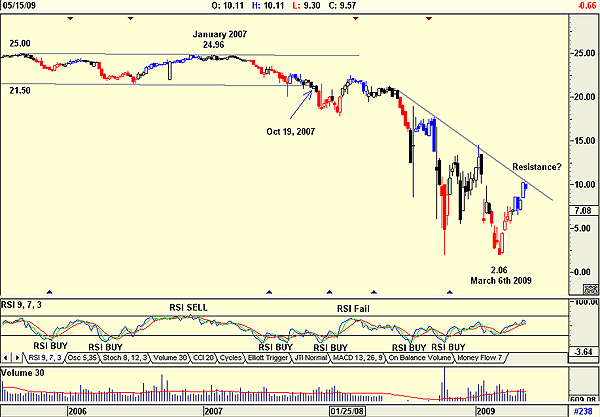
| FIGURE 1: ABN AMRO PREFERRED SHARE E, WEEKLY |
| Graphic provided by: AdvancedGET. |
| |
| Figure 1, a weekly chart of ABN Amro Preferred E shares, shows how the share price traded $21.50 to $25, and then on October 19, 2007, it broke its long-term support line and fell dramatically on high weekly volatility, as you can see from the chart. The question, of course, is the effectiveness of the resistance line shown on the chart. The relative strength index (RSI), and I have used a nine-week RSI, shows how the buy signals given were not successful. |

|
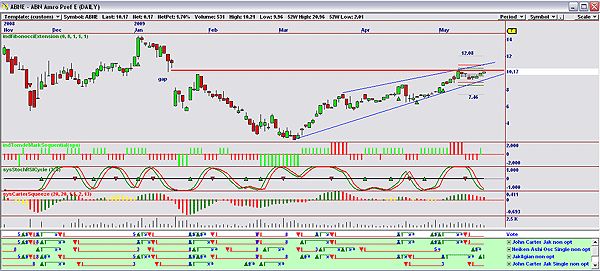
| FIGURE 2: ABN AMRO PREFERRED SHARE, DAILY |
| Graphic provided by: OmniTrader. |
| |
| Figure 2 is an OmniTrader chart with following indicators: a. Tom DeMark Sequential indicator, which gave a sell signal nine days ago, but has not yet given a buy signal. b. The stochastic RSI cycle indicator, which is close to giving a buy signal. c. The Carter Squeeze indicator, also still in sell mode. d. The chart trendlines are suggesting a rising wedge, which does mean a retest of the lows. e. The chart also shows how the price has risen to fill the gap and is meeting strong resistance at present levels. f. Fibonacci retracement levels are suggesting a target on the downside of 7.46 and an upside target of $12.08, should it break through the strong resistance trendlines. g. Note how volume has fallen as the price rose, a sign of weakness. h. Finally, do note that the vote line on the chart, the result of averaging the various signals given, is still suggesting negativity. Those investors who are looking for a high yield could watch this preferred share. The numerous news reports are all positive for the company, but the final intention of the stakeholders of RFS Holdings are unclear. One thing is certain, however — the bank will not be allowed to fail. It is too diversified throughout the world, and as the world's financial system recovers, it will become an extremely valuable asset. |
Has been a technical analyst since 1969, and has worked as a futures and options trader with First Financial Futures in Johannesburg, South Africa.
| Address: | 3256 West 24th Ave |
| Vancouver, BC | |
| Phone # for sales: | 6042634214 |
| E-mail address: | petroosp@gmail.com |
Click here for more information about our publications!
PRINT THIS ARTICLE

Request Information From Our Sponsors
- StockCharts.com, Inc.
- Candle Patterns
- Candlestick Charting Explained
- Intermarket Technical Analysis
- John Murphy on Chart Analysis
- John Murphy's Chart Pattern Recognition
- John Murphy's Market Message
- MurphyExplainsMarketAnalysis-Intermarket Analysis
- MurphyExplainsMarketAnalysis-Visual Analysis
- StockCharts.com
- Technical Analysis of the Financial Markets
- The Visual Investor
- VectorVest, Inc.
- Executive Premier Workshop
- One-Day Options Course
- OptionsPro
- Retirement Income Workshop
- Sure-Fire Trading Systems (VectorVest, Inc.)
- Trading as a Business Workshop
- VectorVest 7 EOD
- VectorVest 7 RealTime/IntraDay
- VectorVest AutoTester
- VectorVest Educational Services
- VectorVest OnLine
- VectorVest Options Analyzer
- VectorVest ProGraphics v6.0
- VectorVest ProTrader 7
- VectorVest RealTime Derby Tool
- VectorVest Simulator
- VectorVest Variator
- VectorVest Watchdog
