HOT TOPICS LIST
- MACD
- Fibonacci
- RSI
- Gann
- ADXR
- Stochastics
- Volume
- Triangles
- Futures
- Cycles
- Volatility
- ZIGZAG
- MESA
- Retracement
- Aroon
INDICATORS LIST
LIST OF TOPICS
PRINT THIS ARTICLE
by Ron Walker
In recent days, we have started to see the tech sector struggle. In early May the Powershares QQQ Trust broke its rising trendline and started to display some weakness. If we follow the money, we can find where new interest is. While the techonology sector is busy breaking down, other sectors are breaking out.
Position: N/A
Ron Walker
Ron Walker is an active trader and technical analyst. He operates an educational website dedicated to the study of Technical Analysis. The website offers free market analysis with daily video presentations and written commentaries. Ron is a video pioneer, being one of the first to utilize the internet producing Technical Analysis videos. His website is thechartpatterntrader.com
PRINT THIS ARTICLE
BREAKOUTS
Rotation Out Of Tech For QQQQ
05/19/09 09:12:31 AMby Ron Walker
In recent days, we have started to see the tech sector struggle. In early May the Powershares QQQ Trust broke its rising trendline and started to display some weakness. If we follow the money, we can find where new interest is. While the techonology sector is busy breaking down, other sectors are breaking out.
Position: N/A
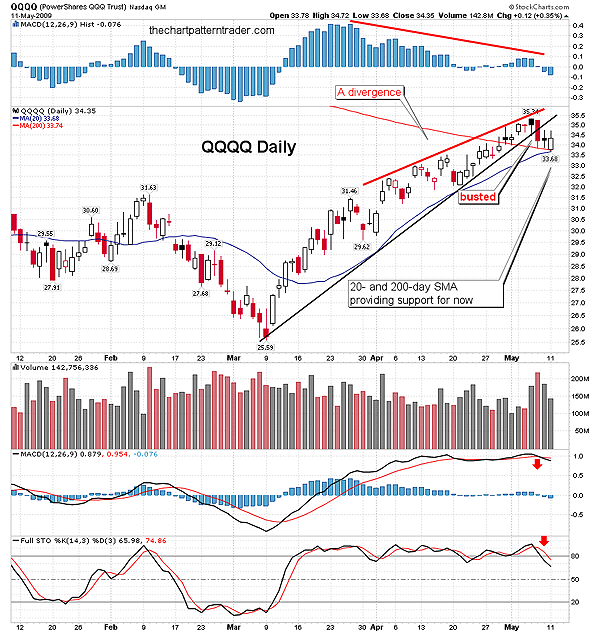
| In Figure 1, the QQQQ daily chart formed a divergence with the moving average convergence/divergence (MACD) histogram. Note how the recent histogram tower was much smaller than the previous peaks that were made. After the last histogram peak was made, the bars began to decline and move below the zero line. While the bearish divergence was setting up on histogram, a bearish candlestick was busy forming. The QQQQ daily chart formed a bearish one-day hanging man pattern. This particular candle had a black real body. Black candles often accompany price peaks. The candlestick was confirmed the following session as the next candle closed below the lowest low of the hanging man pattern, while simultaneously breaking the rising trendline. Currently, the QQQQ is resting on its 200-day simple moving average (SMA); nevertheless, the MACD did get a bearish crossover, providing additional clues that the selling may have just begun. We are likely seeing the early signs that a corrective move is taking place in the tech sector. |

|
| FIGURE 1: POWERSHARES QQQ TRUST (QQQQ), DAILY. The QQQQ is breaking down from a rising wedge after a bearish divergence has taken its toll. A black hanging man one-day candle pattern marked the top. Both the MACD and the stochastic are in the early stages of a breakdown. |
| Graphic provided by: StockCharts.com. |
| |
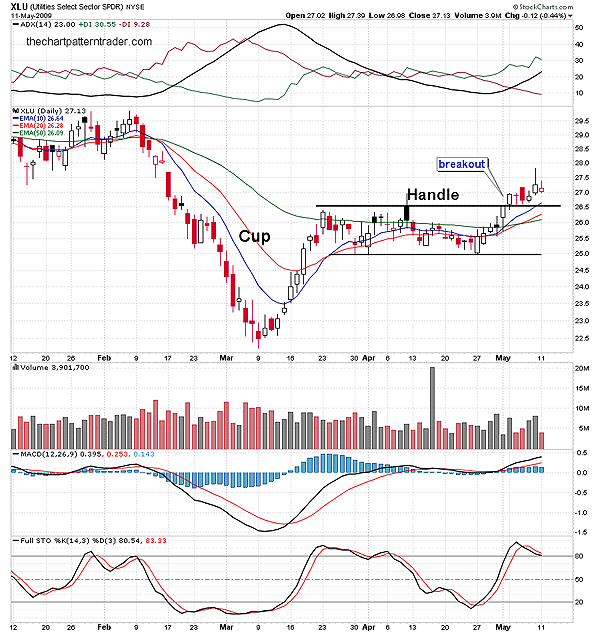
| There is some evidence that investors are starting to take some profit in the technology, and moving that capital into some of the sectors that have been lagging the market. The fact that underperformers are now starting to breakout of their bases reinforces the idea that corrective forces may be a work in the broad market. In recent days, we have witnessed breakouts in the utilities, health-care, and consumer staples sectors. In Figure 2, the Utilities Select Sector SPDR (XLU) daily chart hasn't been participating in the rally. XLU bottomed along with the rest of the market in early March, but after prices rallied for two weeks, it formed an ascending scallop as the advanced stalled and prices began to move in a lateral range between $25 and $26.50. This formed a base that looks to be an extended handle off a cup formation made in March. XLU broke out of the handle in early May. The breakout was confirmed by a bullish MACD cross above its zero line. |

|
| FIGURE 2: UTILITIES SELECT SECTOR (XLU), DAILY. Here, utilities rallied briefly in March but failed to participate while the market was rallying. This allowed for a long handle to form after a cup pattern. The handle makes for a solid base. |
| Graphic provided by: StockCharts.com. |
| |
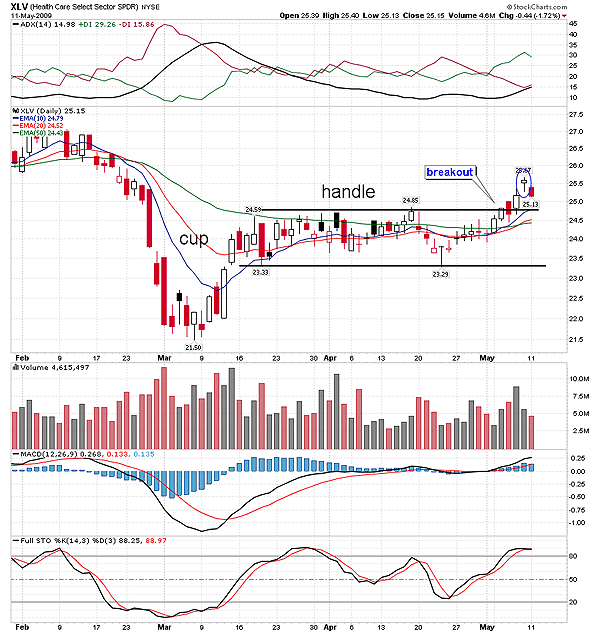
| Figure 3 shows that the Health Care Select Sector SPDR (XLV) also lagged behind as prices consolidated for six weeks, forming another lengthy handle, after a rounding cup formation appeared after prices bottomed out in March. Then in early May, XLV broke above the $24.80 area of resistance. This breakout is legitimate, because both the 10- and 20 day exponential moving averages (EMA) broke above the 50-day EMA. Further, the breakout came on increasing volume. However, a bearish hammer formed recently, which was confirmed the following session. This will make way for a backtest of the break and test support at the $24.80 area. |

|
| FIGURE 3: HEALTH CARE SELECT SECTOR (XLV), DAILY. Another cup pattern made an appearance on XLV. Note the moving averages flattened out during the consolidation. Finally, at the breakout, the 10- and 20-day EMAs broke above the 50-day EMA. A hanging man candle (circled in blue) could result in a backtest to support. |
| Graphic provided by: StockCharts.com. |
| |
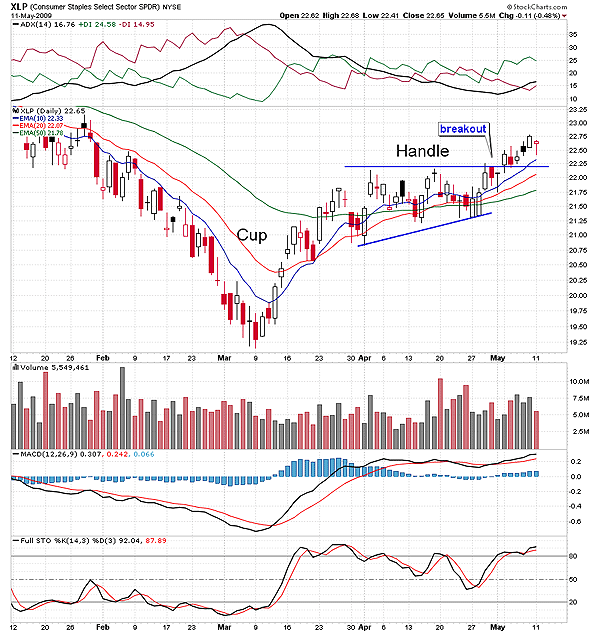
| In Figure 4, the Consumers Staples Select Sector SPDR (XLP) managed to rise longer than the two previous sectors mentioned. But the rally on XLP only lasted until April. XLF then began making some back-and-forth swings, building into a base in the form of an ascending triangle. The triangle pattern broke out in early May. The ADX line bottomed at that time and is currently on the rise, strengthening the positive directional movement indicator (+DI) after its recent bullish cross that occurred while XLP was still building a base in the triangle. |

|
| FIGURE 4: CONSUMER STAPLES SELECT SECTOR (XLP), DAILY. After XLP rallied off the March lows, it formed a continution as an ascending triangle. XLP began to show signs of strength just as the QQQQ demonstrated signs of weakness. |
| Graphic provided by: StockCharts.com. |
| |
| If the market begins a sharp correction, we may see more fresh capital pour into XLP, XLV, and XLU. Consumer staples, health care, and utilities are often a safe haven to park money in uncertain times. Letting the techs continue to ride may just seem to be too risky for some investors at these extended levels. In addition, there is newfound strength in some commodities. At the same time these exchange traded funds (ETFs) were breaking out of their bases, the crude oil and coal broke out their bases in the daily time frame. The energy ETF (XLE) broke out simultaneously with crude oil. At that same time, gold broke out of a bullish falling wedge pattern on its daily chart. |
Ron Walker is an active trader and technical analyst. He operates an educational website dedicated to the study of Technical Analysis. The website offers free market analysis with daily video presentations and written commentaries. Ron is a video pioneer, being one of the first to utilize the internet producing Technical Analysis videos. His website is thechartpatterntrader.com
| Website: | thechartpatterntrader.com |
| E-mail address: | thechartpatterntrader@gmail.com |
Click here for more information about our publications!
Comments
Date: 05/20/09Rank: 5Comment:

Request Information From Our Sponsors
- StockCharts.com, Inc.
- Candle Patterns
- Candlestick Charting Explained
- Intermarket Technical Analysis
- John Murphy on Chart Analysis
- John Murphy's Chart Pattern Recognition
- John Murphy's Market Message
- MurphyExplainsMarketAnalysis-Intermarket Analysis
- MurphyExplainsMarketAnalysis-Visual Analysis
- StockCharts.com
- Technical Analysis of the Financial Markets
- The Visual Investor
- VectorVest, Inc.
- Executive Premier Workshop
- One-Day Options Course
- OptionsPro
- Retirement Income Workshop
- Sure-Fire Trading Systems (VectorVest, Inc.)
- Trading as a Business Workshop
- VectorVest 7 EOD
- VectorVest 7 RealTime/IntraDay
- VectorVest AutoTester
- VectorVest Educational Services
- VectorVest OnLine
- VectorVest Options Analyzer
- VectorVest ProGraphics v6.0
- VectorVest ProTrader 7
- VectorVest RealTime Derby Tool
- VectorVest Simulator
- VectorVest Variator
- VectorVest Watchdog
