HOT TOPICS LIST
- MACD
- Fibonacci
- RSI
- Gann
- ADXR
- Stochastics
- Volume
- Triangles
- Futures
- Cycles
- Volatility
- ZIGZAG
- MESA
- Retracement
- Aroon
INDICATORS LIST
LIST OF TOPICS
PRINT THIS ARTICLE
by Donald W. Pendergast, Jr.
Cycle analysis can sometimes help time a successful stock trade; a potential quarterly cycle low in Harmony Gold Mining appears to offer traders a buying opportunity.
Position: Accumulate
Donald W. Pendergast, Jr.
Donald W. Pendergast is a financial markets consultant who offers specialized services to stock brokers and high net worth individuals who seek a better bottom line for their portfolios.
PRINT THIS ARTICLE
CYCLES
Harmony Gold Mining's Major Quarterly Cycle Low
05/19/09 08:38:16 AMby Donald W. Pendergast, Jr.
Cycle analysis can sometimes help time a successful stock trade; a potential quarterly cycle low in Harmony Gold Mining appears to offer traders a buying opportunity.
Position: Accumulate
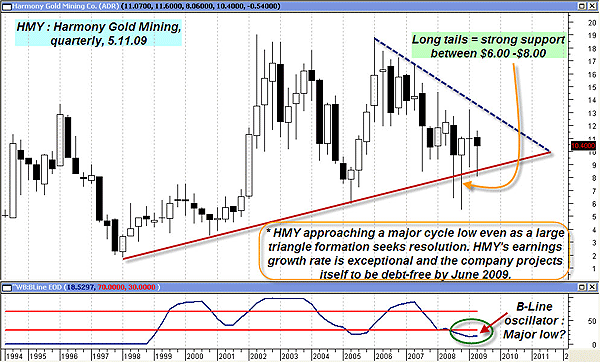
| Gold mining stocks are a volatile bunch. Sometimes it seems like they're the James Deans and Marlon Brandos of the US equity markets, rebels without a cause that frequently decouple from the price of gold itself. One of the world's largest gold mines is South African–based Harmony Gold Mining (HMY), currently ranked as the fifth-largest global producer of gold. Shares of HMY have had quite a ride over the past 15 years, ranging from a low of $1.81 to a high of $19. The most recent primary trend in the stock has been down, but a variety of fundamental and technical factors suggest that HMY is at or near a major inflection point that could see the share price move back into bull market territory. The quarterly chart provides the necessary technical clues we seek in order to evaluate HMY. See Figure 1. |

|
| Graphic provided by: MetaStock. |
| Graphic provided by: WB EOD B-Line from Profit Trader for MetaStock. |
| |
| HMY has had two major bull phases since early 1998; the first saw prices rise by 900% from March 1998 through December 2002 and the second also showed a significant gain, raking in gains of about 250% from July 2005 thru March 2006. Obviously, this stock can and does make powerful, long-lasting trend moves every few years. Given the fact that the WB B-line oscillator (bottom of the chart) is at a very oversold level even as HMY has manifested very strong support levels between $6.00 and $8.00 (as confirmed by the extremely long tails on the most recent series of quarterly candlesticks) does seem to give some added weight to the bullish side of the equation, especially as that huge triangle formation (partly constructed from a very solid-looking four-point up trendline, no less) seeks a potential resolution by way of a bullish or bearish breakout move. Fundamentally, HMY also appears to be in tip-top condition; the company projects itself to be debt-free sometime in the next month (no small feat in a world in which individuals, corporations, and governments are collectively drowning in a sea of red ink) and its earnings growth rate is also swinging to the profitable side of the ledger. Gold has been rising in South African rands, which is also a major plus for the company's financial situation. |
| Here's a very simple longer-term trade setup for HMY, one that won't need constant monitoring: For every 100 shares of HMY you purchase, sell one January 2010 $10 call option against the shares. Currently, each call will fetch about $2.20, nearly 21% of the value of the stock itself. If the stock is called away at expiration (248 days from today), this covered call play stands to clear a rate of return of about 26% on an annualized basis. Given that the stock is at $10.40 (as of today's close on May 11, 2009), the breakeven on this setup is near $8.20, which is also near the top of that aforementioned zone of heavy buying pressure in this stock. If the stock makes a weekly close below $8.00, consider selling out at a reasonable loss, unless of course you're a true believer in HMY's ability to once again challenge its former highs near $18.00–19.00. |
| All in all, this at-the-money (ATM) covered call play looks like a sane balance of risk versus reward in a stock that has a full slate of favorable fundamental and technical readings stacked in its favor. |
Donald W. Pendergast is a financial markets consultant who offers specialized services to stock brokers and high net worth individuals who seek a better bottom line for their portfolios.
| Title: | Writer, market consultant |
| Company: | Linear Trading Systems LLC |
| Jacksonville, FL 32217 | |
| Phone # for sales: | 904-239-9564 |
| E-mail address: | lineartradingsys@gmail.com |
Traders' Resource Links | |
| Linear Trading Systems LLC has not added any product or service information to TRADERS' RESOURCE. | |
Click here for more information about our publications!
Comments
Date: 05/20/09Rank: 5Comment:

|

Request Information From Our Sponsors
- StockCharts.com, Inc.
- Candle Patterns
- Candlestick Charting Explained
- Intermarket Technical Analysis
- John Murphy on Chart Analysis
- John Murphy's Chart Pattern Recognition
- John Murphy's Market Message
- MurphyExplainsMarketAnalysis-Intermarket Analysis
- MurphyExplainsMarketAnalysis-Visual Analysis
- StockCharts.com
- Technical Analysis of the Financial Markets
- The Visual Investor
- VectorVest, Inc.
- Executive Premier Workshop
- One-Day Options Course
- OptionsPro
- Retirement Income Workshop
- Sure-Fire Trading Systems (VectorVest, Inc.)
- Trading as a Business Workshop
- VectorVest 7 EOD
- VectorVest 7 RealTime/IntraDay
- VectorVest AutoTester
- VectorVest Educational Services
- VectorVest OnLine
- VectorVest Options Analyzer
- VectorVest ProGraphics v6.0
- VectorVest ProTrader 7
- VectorVest RealTime Derby Tool
- VectorVest Simulator
- VectorVest Variator
- VectorVest Watchdog
