HOT TOPICS LIST
- MACD
- Fibonacci
- RSI
- Gann
- ADXR
- Stochastics
- Volume
- Triangles
- Futures
- Cycles
- Volatility
- ZIGZAG
- MESA
- Retracement
- Aroon
INDICATORS LIST
LIST OF TOPICS
PRINT THIS ARTICLE
by Donald W. Pendergast, Jr.
Stillwater Mining, the only platinum/palladium miner in the US, appears to have caught a major bid as it attempts to finally overcome a major zone of resistance that has repeatedly turned back prior advances.
Position: Accumulate
Donald W. Pendergast, Jr.
Donald W. Pendergast is a financial markets consultant who offers specialized services to stock brokers and high net worth individuals who seek a better bottom line for their portfolios.
PRINT THIS ARTICLE
SUPPORT & RESISTANCE
Stillwater Mining Major Resistance Challenge Approaches
05/05/09 08:54:14 AMby Donald W. Pendergast, Jr.
Stillwater Mining, the only platinum/palladium miner in the US, appears to have caught a major bid as it attempts to finally overcome a major zone of resistance that has repeatedly turned back prior advances.
Position: Accumulate
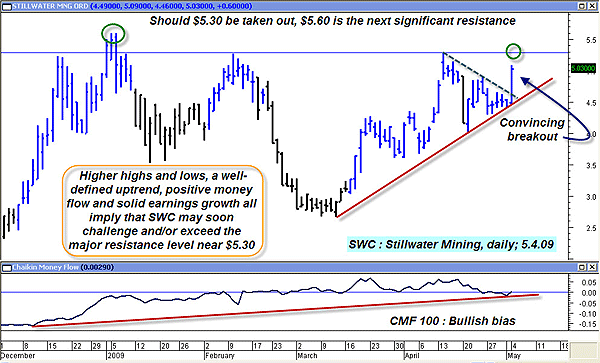
| Stillwater Mining (SWC) is projected to rapidly increase its earnings growth (which is currently in negative territory) during the next 18 months, and this news has certainly helped the company's common stock over the past several months. SWC actively participated in each of the last two major broad market reversals (November 2008 and March 2009), posting major gains each time. Right now, the stock has just staged a very convincing bullish breakout, one that may be destined to launch SWC shares over and above the twin resistance areas that reside at $5.30 and $5.60. See Figure 1. |

|
| FIGURE 1: SWC, DAILY. Stillwater Mining appears to be on track for another test of the $5.30 resistance area, and fairly soon. |
| Graphic provided by: MetaStock. |
| |
| Technically, the SWC daily chart seen in Figure 1 projects a decidedly bullish image of a stock on a collision course with a major overhead resistance area, a price zone that has proven to be tough for SWC to exceed during the past five months. All of the ingredients needed to fuel further momentum gains are present — a well-established uptrend, buoyant long-term money flows (depicted by the Chaikin money flow [CMF][100]), projected increases in earnings growth and a wide-range breakout from a pennant formation. The location of the pennant in the existing market structure also implies that a successful continuation of the breakout could eventually meet a price target in the $6.00 + zone, maybe even higher. |
| Given the gradual rebound in global commodity prices (palladium and platinum futures prices also having enjoyed a wonderful rebound since November 2008), one way to engage this breakout move in SWC would be to trade it as a trend-following move. Waiting for an intraday reversal on a 30-minute chart might allow traders a better entry price and subsequent risk-reward ratio (RR), allowing them to ride out a potential continuation move higher in this mining stock. An initial stop could be placed just below today's wide-range breakout bar, near $4.39. If price follows through, then a trailing volatility-stop (a 2.5 * ATR10 or 2.0 * ATR10 version) could be employed to help lock in any further gains. SWC could also be a decent covered-call play, as a June $5 SWC call can be sold for approximately 0.65 (nearly 13% of the value of 100 shares of SWC). If your 100 shares of SWC are called away at $5 at June expiration, the trade stands to net an annualized return of nearly 100%, not bad for a 45-day commitment of time and trading capital. To manage this covered call trade, simply use the red long-term up trendline as both an initial stop and a trailing stop. Any daily close below the trendline should serve as either a notice to either close the trade out and/or to monitor it much more closely (should it already have moved into the profit zone due to time decay or lack of price movement). Given the solid intermediate-term fundamentals and technicals in SWC, either style of trade appears to be a fairly low-risk proposition, depending on how large a stock or stock/option position you eventually choose to put on. |
Donald W. Pendergast is a financial markets consultant who offers specialized services to stock brokers and high net worth individuals who seek a better bottom line for their portfolios.
| Title: | Writer, market consultant |
| Company: | Linear Trading Systems LLC |
| Jacksonville, FL 32217 | |
| Phone # for sales: | 904-239-9564 |
| E-mail address: | lineartradingsys@gmail.com |
Traders' Resource Links | |
| Linear Trading Systems LLC has not added any product or service information to TRADERS' RESOURCE. | |
Click here for more information about our publications!
Comments
Date: 05/06/09Rank: 4Comment:

Request Information From Our Sponsors
- VectorVest, Inc.
- Executive Premier Workshop
- One-Day Options Course
- OptionsPro
- Retirement Income Workshop
- Sure-Fire Trading Systems (VectorVest, Inc.)
- Trading as a Business Workshop
- VectorVest 7 EOD
- VectorVest 7 RealTime/IntraDay
- VectorVest AutoTester
- VectorVest Educational Services
- VectorVest OnLine
- VectorVest Options Analyzer
- VectorVest ProGraphics v6.0
- VectorVest ProTrader 7
- VectorVest RealTime Derby Tool
- VectorVest Simulator
- VectorVest Variator
- VectorVest Watchdog
- StockCharts.com, Inc.
- Candle Patterns
- Candlestick Charting Explained
- Intermarket Technical Analysis
- John Murphy on Chart Analysis
- John Murphy's Chart Pattern Recognition
- John Murphy's Market Message
- MurphyExplainsMarketAnalysis-Intermarket Analysis
- MurphyExplainsMarketAnalysis-Visual Analysis
- StockCharts.com
- Technical Analysis of the Financial Markets
- The Visual Investor
