HOT TOPICS LIST
- MACD
- Fibonacci
- RSI
- Gann
- ADXR
- Stochastics
- Volume
- Triangles
- Futures
- Cycles
- Volatility
- ZIGZAG
- MESA
- Retracement
- Aroon
INDICATORS LIST
LIST OF TOPICS
PRINT THIS ARTICLE
by Dennis D. Peterson
Ready to move up or just sideways?
Position: N/A
Dennis D. Peterson
Market index trading on a daily basis.
PRINT THIS ARTICLE
SUPPORT & RESISTANCE
Support and Resistance on QCOM
08/30/01 03:34:42 PMby Dennis D. Peterson
Ready to move up or just sideways?
Position: N/A
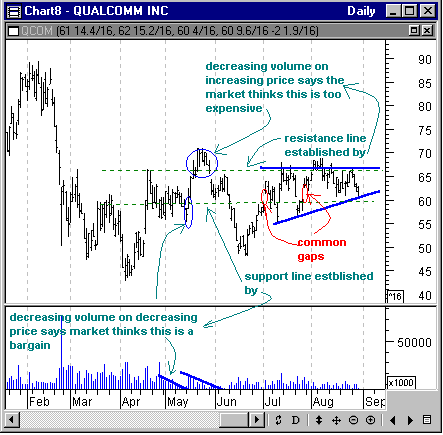
| Despite some recent revenue problems Qualcom, Inc. (QCOM: Nasdaq) manages to shrug off some market declines. While the Nasdaq composite has lost 50% over the last year QCOM is about where it started from a year ago. Looking at the chart of QCOM (Figure 1) recent volume history says the market is making up its mind on where price should go, but price does fit some events that occurred in the recent past. |
| QCOM had a steep sell-off in late February marked by a large volume spike that said the market had gone too far, and everyone was selling out of panic. As the market attempted to correct in March and April the first sign of resistance showed up on March 6 and April 19 at a price of $66.5/share. A mid-May move down on decreasing volume got to a level the market considered a bargain and again price went back up. But the break through resistance at $66.5 was on decreasing volume. Time to retrace again. |

|
| Figure 1: QCOM Daily Price and Volume History. Price moves in mid and late May have established resistance and support that are currently holding. |
| Graphic provided by: MetaStock. |
| Graphic provided by: Data vendor: eSignal<. |
| |
| It's no accident that common gaps, at the beginning and end of July, occur at around $59.5/share as this marks the same support level the market showed in it's mid-May push down to what the market considered a bargain. While the technology market continues to decline, a stock that manages to hold its head above water is a candidate for strong moves in the future. Recent volume levels show the market is comfortable with a price range of $59.5 to $66.5. An ascending triangle (Figure 1: heavy blue lines) is developing, but I would be more comfortable if I saw some increasing volume on the upside moves to show some enthusiasm for accumulating the stock. Accumulation/Distribution for the last few weeks is about flat. I would think the ascending triangle is not a strong one, that is, not likely to result in an upside breakout, at least not in the near term. More likely is that QCOM will move sideways, which for support and resistance traders is not that bad of a deal. |
Market index trading on a daily basis.
| Title: | Staff Writer |
| Company: | Technical Analysis, Inc. |
| Address: | 4757 California Ave SW |
| Seattle, WA 98116-4499 | |
| Phone # for sales: | 206 938 0570 |
| Fax: | 206 938 1307 |
| Website: | www.traders.com |
| E-mail address: | dpeterson@traders.com |
Traders' Resource Links | |
| Charting the Stock Market: The Wyckoff Method -- Books | |
| Working-Money.com -- Online Trading Services | |
| Traders.com Advantage -- Online Trading Services | |
| Technical Analysis of Stocks & Commodities -- Publications and Newsletters | |
| Working Money, at Working-Money.com -- Publications and Newsletters | |
| Traders.com Advantage -- Publications and Newsletters | |
| Professional Traders Starter Kit -- Software | |
Click here for more information about our publications!
Comments

Request Information From Our Sponsors
- StockCharts.com, Inc.
- Candle Patterns
- Candlestick Charting Explained
- Intermarket Technical Analysis
- John Murphy on Chart Analysis
- John Murphy's Chart Pattern Recognition
- John Murphy's Market Message
- MurphyExplainsMarketAnalysis-Intermarket Analysis
- MurphyExplainsMarketAnalysis-Visual Analysis
- StockCharts.com
- Technical Analysis of the Financial Markets
- The Visual Investor
- VectorVest, Inc.
- Executive Premier Workshop
- One-Day Options Course
- OptionsPro
- Retirement Income Workshop
- Sure-Fire Trading Systems (VectorVest, Inc.)
- Trading as a Business Workshop
- VectorVest 7 EOD
- VectorVest 7 RealTime/IntraDay
- VectorVest AutoTester
- VectorVest Educational Services
- VectorVest OnLine
- VectorVest Options Analyzer
- VectorVest ProGraphics v6.0
- VectorVest ProTrader 7
- VectorVest RealTime Derby Tool
- VectorVest Simulator
- VectorVest Variator
- VectorVest Watchdog
