HOT TOPICS LIST
- MACD
- Fibonacci
- RSI
- Gann
- ADXR
- Stochastics
- Volume
- Triangles
- Futures
- Cycles
- Volatility
- ZIGZAG
- MESA
- Retracement
- Aroon
INDICATORS LIST
LIST OF TOPICS
PRINT THIS ARTICLE
by Ron Walker
After a massive decline in crude oil during the last half of 2008, it staged a stealth recovery in early 2009. Crude oil is now under consolidation. But is it possible that crude oil is attempting a comeback? Tensions are once again mounting in the Middle East, while the Organization of the Petroleum Exporting Countries (OPEC) is continuing to aggressively cut production in order to shrink supply. During this recession, the US is racking up recordbreaking deficits that in time will devalue the dollar and create inflation. But these actions will only strengthen commodities over the long term.
Position: N/A
Ron Walker
Ron Walker is an active trader and technical analyst. He operates an educational website dedicated to the study of Technical Analysis. The website offers free market analysis with daily video presentations and written commentaries. Ron is a video pioneer, being one of the first to utilize the internet producing Technical Analysis videos. His website is thechartpatterntrader.com
PRINT THIS ARTICLE
TECHNICAL ANALYSIS
Crude's Continuous Contract Consolidates
05/04/09 01:29:53 PMby Ron Walker
After a massive decline in crude oil during the last half of 2008, it staged a stealth recovery in early 2009. Crude oil is now under consolidation. But is it possible that crude oil is attempting a comeback? Tensions are once again mounting in the Middle East, while the Organization of the Petroleum Exporting Countries (OPEC) is continuing to aggressively cut production in order to shrink supply. During this recession, the US is racking up recordbreaking deficits that in time will devalue the dollar and create inflation. But these actions will only strengthen commodities over the long term.
Position: N/A
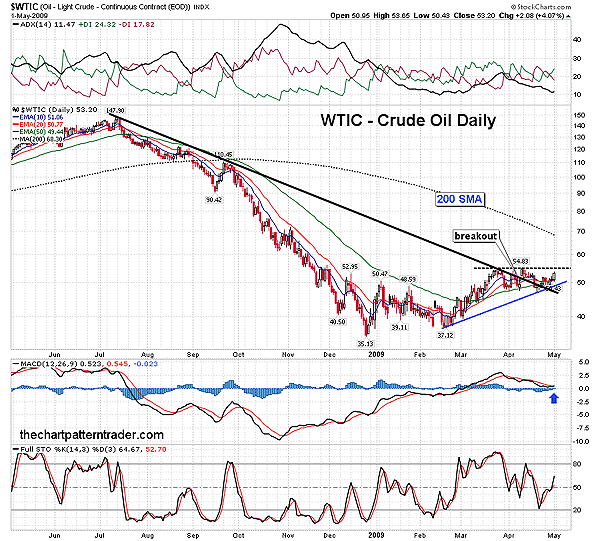
| The ailing economy has resulted in slowing demand for crude oil, thus driving prices down from the peak made last July at $147 (Figure 1). The sharp selloff caused the Oil Light Crude Continuous Contract Index ($WTIC) to decline until late December 2008, when prices bottomed out at $35. From there, a robust rally quickly carried $WTIC back to peak $50 in January 2009 (Figure 2). Then a brief falling price channel emerged over the next seven weeks. After putting in a higher low in mid-February, prices began a reversal and rallied up to close above the 50-day exponential moving average (EMA). This is the first close above the 50-day EMA since the downtrend began in summer 2008. The invigorating rally to the 50-day EMA was a direct result of a three-white-soldiers candle pattern (circled in black in Figure 2) that formed after a higher low had been put in. Note the three white soldiers broke above the bearish channel, ending the downtrend from the January peak. |

|
| FIGURE 1: $WTIC, DAILY. A one-year view of the daily charts shows the break of the long-term trend and its successful backtest. If a breakout occurs above overhead resistance at $55, prices may catapult to test the 200-day SMA currently hovering near $68. |
| Graphic provided by: StockCharts.com. |
| |
| Subsequently, $WTIC broke to new highs in mid-March (Figure 2), but the advance stalled shortly after that at $55 a barrel. A consolidation was now under way after the huge lunge from 37 to 55. A base began to develop as prices drifted sideways through April. April ended with another important test as $WTIC came into contact with the rising trendline from the momentum lows made in February. The $WTIC is currently moving in a narrow range as consolidation occurs between $47 and $55 a barrel, with a solid support near $48. In Figure 2, the average directional movement index (ADX)(14) has been declining while the positive directional index (+DI) and the negative directional index (-DI) have been intertwining throughout the consolidation phase, confirming that prices are currently trendless. However, the most recent DI cross was bullish, placing the +DI above the -DI line. Should $WTIC break out above $55, the ADX line will begin to rise to strengthen the +DI line, which should renew the advance on the price chart. |

|
| FIGURE 2: $WTIC, DAILY. An inspiring reversal off the rising trend and horizontal support occurs as the $WTIC firms up off the 50-day EMA. During the consolidation phase, the MACD has made its way back to the zero line for a test, while the stochastic gets reenergized moving above 50. |
| Graphic provided by: StockCharts.com. |
| |
| Prices are now trying to firm up off the 50-day EMA after the moving average convergence/divergence (MACD) (12, 26,9) made a brief test back to the zero line during the consolidation. The stochastic (14, 3, 3) shows that momentum is bullish, as it is surging off oversold levels above the value of 50. Looking back at Figure 1, you will note that during the consolidation in the daily time frame, $WTIC did break out of the long-term trendline from its peak at $147. The broken trendline successfully backtested when $WTIC tested its rising trendline mid-April. Once prices clear $55 and break out of their current base, $WTIC will not have much in the way of resistance until its 200-day simple moving average (SMA), which is currently hovering near $68. |

|
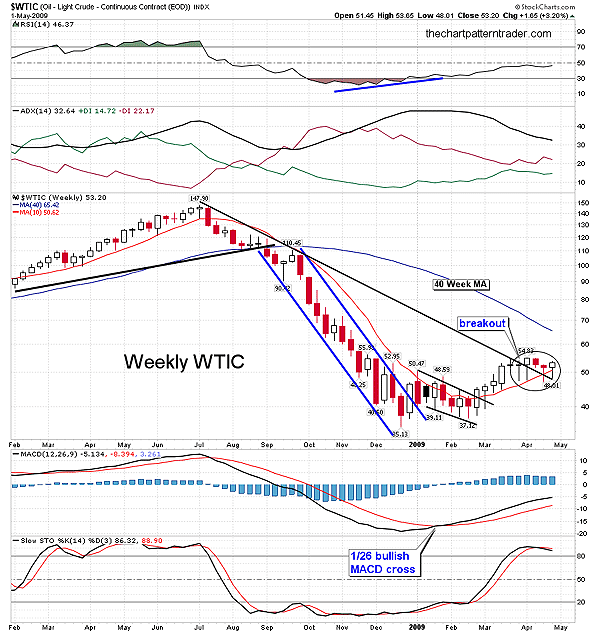
| FIGURE 3: $WTIC, WEEKLY. Note the cluster of hammer candlesticks, with long tails that have formed at key support. Moreover, two hammer candlesticks formed as prices backtested the trendline as prices rest on the 10-week moving average. |
| Graphic provided by: StockCharts.com. |
| |
| The weekly chart of $WTIC seen in Figure 3 shows that the breaking of the long-term downtrend has not yet been confirmed by the ADX. The positive -DI line remains above +DI; nevertheless, volatility has been declining off overheated levels ever since the average directional movement index (ADX) line peaked in February. The relative strength index (RSI) (14) will begin to rise above 50 here in the weekly time frame if the bullish conditions on the $WTIC daily chart persist. The MACD (12, 26, 9) crossed above its signal line in late January and is gradually making its way toward the zero line. Eventually, the MACD needs to move above the zero line in order to confirm the trend break. Now it has the 40-week SMA (blue line) to contend with, which is equivalent to the 200-day simple moving average (SMA) seen on the daily chart in Figure 1. By taking the 200-day SMA and dividing it by five trading sessions per week, we get a 40-week SMA (200 divided by 5 = 40). |
| Prices are finding support just above the 10-week SMA as a small cluster of bullish hammer candlesticks have formed at the backtest. As a matter of fact, there are three hammers and one doji that have appeared just above the $47 level of support. The hammer candlesticks have very similar features, with each displaying long shadows underneath their real bodies, indicating that there is strong demand at $47. |
Ron Walker is an active trader and technical analyst. He operates an educational website dedicated to the study of Technical Analysis. The website offers free market analysis with daily video presentations and written commentaries. Ron is a video pioneer, being one of the first to utilize the internet producing Technical Analysis videos. His website is thechartpatterntrader.com
| Website: | thechartpatterntrader.com |
| E-mail address: | thechartpatterntrader@gmail.com |
Click here for more information about our publications!
Comments
Date: 05/06/09Rank: 4Comment:

Request Information From Our Sponsors
- StockCharts.com, Inc.
- Candle Patterns
- Candlestick Charting Explained
- Intermarket Technical Analysis
- John Murphy on Chart Analysis
- John Murphy's Chart Pattern Recognition
- John Murphy's Market Message
- MurphyExplainsMarketAnalysis-Intermarket Analysis
- MurphyExplainsMarketAnalysis-Visual Analysis
- StockCharts.com
- Technical Analysis of the Financial Markets
- The Visual Investor
- VectorVest, Inc.
- Executive Premier Workshop
- One-Day Options Course
- OptionsPro
- Retirement Income Workshop
- Sure-Fire Trading Systems (VectorVest, Inc.)
- Trading as a Business Workshop
- VectorVest 7 EOD
- VectorVest 7 RealTime/IntraDay
- VectorVest AutoTester
- VectorVest Educational Services
- VectorVest OnLine
- VectorVest Options Analyzer
- VectorVest ProGraphics v6.0
- VectorVest ProTrader 7
- VectorVest RealTime Derby Tool
- VectorVest Simulator
- VectorVest Variator
- VectorVest Watchdog
