HOT TOPICS LIST
- MACD
- Fibonacci
- RSI
- Gann
- ADXR
- Stochastics
- Volume
- Triangles
- Futures
- Cycles
- Volatility
- ZIGZAG
- MESA
- Retracement
- Aroon
INDICATORS LIST
LIST OF TOPICS
PRINT THIS ARTICLE
by Mike Carr, CMT
There is little historical precedent for the past two months of steady gains.
Position: N/A
Mike Carr, CMT
Mike Carr, CMT, is a member of the Market Technicians Association, and editor of the MTA's newsletter, Technically Speaking. He is also the author of "Smarter Investing in Any Economy: The Definitive Guide to Relative Strength Investing," and "Conquering the Divide: How to Use Economic Indicators to Catch Stock Market Trends."
PRINT THIS ARTICLE
STRATEGIES
Eight Straight Weeks
05/04/09 09:18:45 AMby Mike Carr, CMT
There is little historical precedent for the past two months of steady gains.
Position: N/A
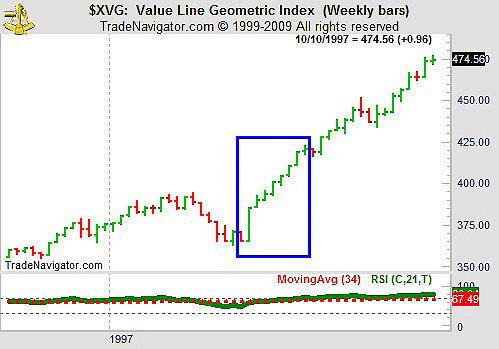
| The week ended May 1 marked eight consecutive weeks of gains in the stock market as measured by the Value Line Composite Index (XVG). The NASDAQ Composite Index matches this streak and the Dow Jones Industrial Average and Standard & Poor's 500 have posted gains in seven of the past eight weeks. Looking back in history, we find two other times when the Value Line rose this strongly. |
| In June 1997, the Value Line also rose eight weeks in a row (Figure 1). After closing lower the next week, the index returned nearly 14% over the next four months before topping. |

|
| Graphic provided by: Trade Navigator. |
| |
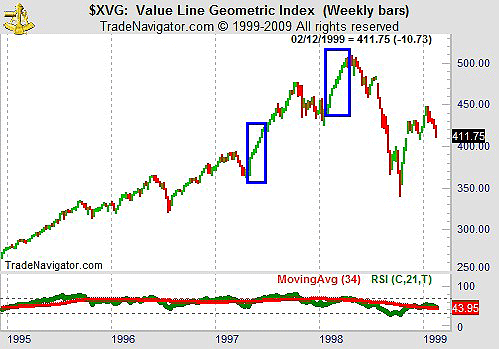
| At the beginning of 1998, XVG also had an eight-week winning streak. This time, the runup marked a top (Figure 2). |

|
| FIGURE 2: $XVG, WEEKLY. XVG topped in 1998 after a similar run. |
| Graphic provided by: Trade Navigator. |
| |
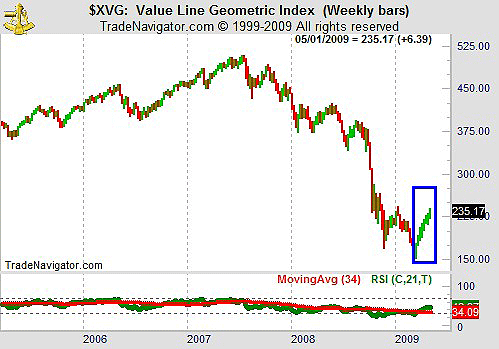
| Does any of this help us forecast what will happen this time? In Figure 3, we see that the current situation is closer to 1997 than 1998. The rally in 1998 occurred with the relative strength index (RSI) at an overbought level. Now, and in 1997, the RSI may support higher prices and signal when the bull move has ended. |

|
| FIGURE 3: $XVG, WEEKLY. XVG has run up strongly, but the RSI is still below 50. |
| Graphic provided by: Trade Navigator. |
| |
| If the RSI crosses above 70, a break below that level is likely to indicate it is time to sell. And prices would have to rise much more before the RSI reaches that level. |
Mike Carr, CMT, is a member of the Market Technicians Association, and editor of the MTA's newsletter, Technically Speaking. He is also the author of "Smarter Investing in Any Economy: The Definitive Guide to Relative Strength Investing," and "Conquering the Divide: How to Use Economic Indicators to Catch Stock Market Trends."
| Website: | www.moneynews.com/blogs/MichaelCarr/id-73 |
| E-mail address: | marketstrategist@gmail.com |
Click here for more information about our publications!
Comments
Date: 05/05/09Rank: 4Comment:

Request Information From Our Sponsors
- StockCharts.com, Inc.
- Candle Patterns
- Candlestick Charting Explained
- Intermarket Technical Analysis
- John Murphy on Chart Analysis
- John Murphy's Chart Pattern Recognition
- John Murphy's Market Message
- MurphyExplainsMarketAnalysis-Intermarket Analysis
- MurphyExplainsMarketAnalysis-Visual Analysis
- StockCharts.com
- Technical Analysis of the Financial Markets
- The Visual Investor
- VectorVest, Inc.
- Executive Premier Workshop
- One-Day Options Course
- OptionsPro
- Retirement Income Workshop
- Sure-Fire Trading Systems (VectorVest, Inc.)
- Trading as a Business Workshop
- VectorVest 7 EOD
- VectorVest 7 RealTime/IntraDay
- VectorVest AutoTester
- VectorVest Educational Services
- VectorVest OnLine
- VectorVest Options Analyzer
- VectorVest ProGraphics v6.0
- VectorVest ProTrader 7
- VectorVest RealTime Derby Tool
- VectorVest Simulator
- VectorVest Variator
- VectorVest Watchdog
