HOT TOPICS LIST
- MACD
- Fibonacci
- RSI
- Gann
- ADXR
- Stochastics
- Volume
- Triangles
- Futures
- Cycles
- Volatility
- ZIGZAG
- MESA
- Retracement
- Aroon
INDICATORS LIST
LIST OF TOPICS
PRINT THIS ARTICLE
by Koos van der Merwe
There is always a line at the Starbucks counter, yet the stock took a hammering. What does the stock's future hold?
Position: Buy
Koos van der Merwe
Has been a technical analyst since 1969, and has worked as a futures and options trader with First Financial Futures in Johannesburg, South Africa.
PRINT THIS ARTICLE
TRIANGLES
Get A Caffeine Lift With Starbucks
05/01/09 09:09:41 AMby Koos van der Merwe
There is always a line at the Starbucks counter, yet the stock took a hammering. What does the stock's future hold?
Position: Buy
| Starbucks. I don't have to write anything about the company. Almost everyone in North America, and many others in the world, have tasted the company's coffee, and either love it or hate it. Isn't the logo one of the most familiar in the world these days? (See Figure 1.) |

|
| FIGURE 1: STARBUCKS. Love it or hate it |
| Graphic provided by: Starbucks. |
| |
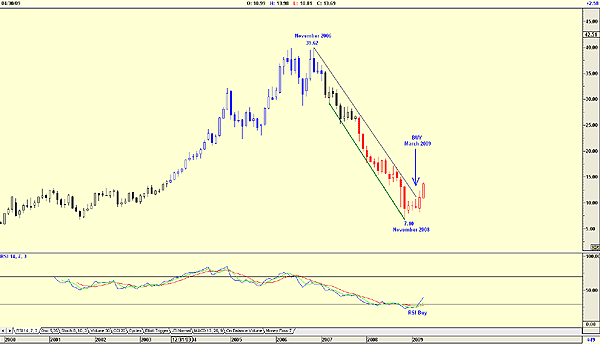
| The Starbucks model was... and, I repeat, was, so successful that copycats galore started up, with even that model consumer-friendly company, McDonalds, offering good coffee at a far cheaper price. Of course, we all know by now that Starbucks overextended itself, opening up too many branches, with many on opposite corners of the same block, and that they have decided to reduce the number of stores worldwide. Starbucks can do that simply because each store is not a franchise, but owned and managed by the parent company. And so the stock price dropped, as shown in Figure 2, a monthly chart from a high of $39.62 in November 2006 to a low of $7.10 by November 2008, and then in March 2009, when the stock price broke above its downward trendline. Was it because of the company's announcement in February about "a breakthrough in instant coffee," promising a taste just like its brewed version? Or was it because Howard Schultz, the founder of Starbucks, taking a page out of the book of Apple's Steve Jobs, returned to manage the company? Whatever the reason, Starbucks once again looks a good buy for a long-term portfolio. |

|
| FIGURE 2: SBUX, MONTHLY |
| Graphic provided by: AdvancedGET. |
| |
| Figure 1 shows how the stock price has broken above the long-term resistance line on March 2009, suggesting a buy signal confirmed by the relative strength index (RSI). |

|
| FIGURE 3: SBUX, DAILY |
| Graphic provided by: AdvancedGET. |
| |
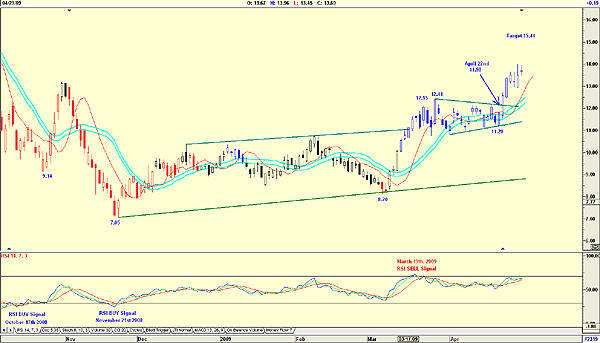
| Figure 3, a daily chart, confirms the buy signal given by the monthly chart, highlighting an initial buy on October 17, 2008, triggered by the RSI, and a second buy on November 21 at $7.05. A sell signal was given on March 19, 2009, when the price was $12.15, as the price moved into a consolidation triangle. A breakout occurred on April 22 when the price was $11.98 suggesting a buy, with a target of $15.44 (12.44 - 8.20 = 4.24 + 11.20 = 15.44). |
| Starbucks appears to be a buy in the immediate short term, with a target of $15.44 for traders. Long-term investors could buy now and add to their position on a pullback from the $15.44 target. |
Has been a technical analyst since 1969, and has worked as a futures and options trader with First Financial Futures in Johannesburg, South Africa.
| Address: | 3256 West 24th Ave |
| Vancouver, BC | |
| Phone # for sales: | 6042634214 |
| E-mail address: | petroosp@gmail.com |
Click here for more information about our publications!
Comments
Date: 05/03/09Rank: 4Comment:
Date: 05/06/09Rank: 5Comment:

Request Information From Our Sponsors
- StockCharts.com, Inc.
- Candle Patterns
- Candlestick Charting Explained
- Intermarket Technical Analysis
- John Murphy on Chart Analysis
- John Murphy's Chart Pattern Recognition
- John Murphy's Market Message
- MurphyExplainsMarketAnalysis-Intermarket Analysis
- MurphyExplainsMarketAnalysis-Visual Analysis
- StockCharts.com
- Technical Analysis of the Financial Markets
- The Visual Investor
- VectorVest, Inc.
- Executive Premier Workshop
- One-Day Options Course
- OptionsPro
- Retirement Income Workshop
- Sure-Fire Trading Systems (VectorVest, Inc.)
- Trading as a Business Workshop
- VectorVest 7 EOD
- VectorVest 7 RealTime/IntraDay
- VectorVest AutoTester
- VectorVest Educational Services
- VectorVest OnLine
- VectorVest Options Analyzer
- VectorVest ProGraphics v6.0
- VectorVest ProTrader 7
- VectorVest RealTime Derby Tool
- VectorVest Simulator
- VectorVest Variator
- VectorVest Watchdog
