HOT TOPICS LIST
- MACD
- Fibonacci
- RSI
- Gann
- ADXR
- Stochastics
- Volume
- Triangles
- Futures
- Cycles
- Volatility
- ZIGZAG
- MESA
- Retracement
- Aroon
INDICATORS LIST
LIST OF TOPICS
PRINT THIS ARTICLE
by Donald W. Pendergast, Jr.
The NASDAQ 100 index is outperforming all of the other major broad market indexes by a wide margin. A closer look at one of this index's highest relative strength stocks reveals a series of bullish technical developments.
Position: Accumulate
Donald W. Pendergast, Jr.
Donald W. Pendergast is a financial markets consultant who offers specialized services to stock brokers and high net worth individuals who seek a better bottom line for their portfolios.
PRINT THIS ARTICLE
REL. STR COMPARATIVE
NASDAQ 100 Continues To Outperform
04/30/09 09:27:33 AMby Donald W. Pendergast, Jr.
The NASDAQ 100 index is outperforming all of the other major broad market indexes by a wide margin. A closer look at one of this index's highest relative strength stocks reveals a series of bullish technical developments.
Position: Accumulate
| The NASDAQ 100 index (.NDX) has been on a tear since the major US markets reversed in early March 2009, easily outpacing the gains made by the .NYA, .SPX, and .RUT. A glance at the relative strength comparison of these major stock indexes reveals that the .NDX has been rising more than twice as fast as its small-cap rival index, the Russell 2000 (Figure 1). However, the .NDX is beginning to demonstrate early signs of trend deceleration, and those playing the stocks in this index (or the index itself) need to be aware of several recent technical developments. |

|
| FIGURE 1: INDEX GAINS. The NASDAQ 100 is outpacing the Russell 2000's gains by a margin of better than 2:1. |
| Graphic provided by: MetaStock. |
| |
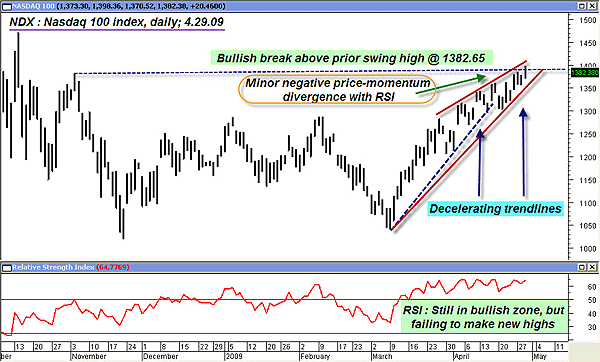
| The daily graph of the .NDX (Figure 2) shows just how powerful the reversal rally has been over the past seven weeks; there hasn't even been a Fibonacci 38.2% corrective move at any stage of the move so far, which is very impressive. The .NDX easily took out the February 2009 swing high and then proceeded to breach the November 2008 swing high during today's session. It closed just a quarter point below that swing high today, and a close above 1382.65 will further enhance the bullish posture of the .NDX. Bullish close above that level or not, the chart also reveals that the uptrend lines have begun to decelerate even as the RSI (14) indicator has failed to make new highs in conjunction with the price action of the index itself. This modest exhibition of negative price-momentum divergence is another potential early warning that the .NDX is due for a breather. Those attempting to trade in the various component stocks in the .NDX would do well to focus on those with superior relative strength (RS) if going long and on those with especially weak relative strength if going short. Next up is a look at one of the highest relative strength stocks in the NASDAQ 100. |

|
| FIGURE 2: NDX, DAILY. Still outperforming the rest of the major US stock indexes, the .NDX begins to exhibit signs of slowing momentum as its November 2008 swing high is approached. |
| Graphic provided by: MetaStock. |
| |
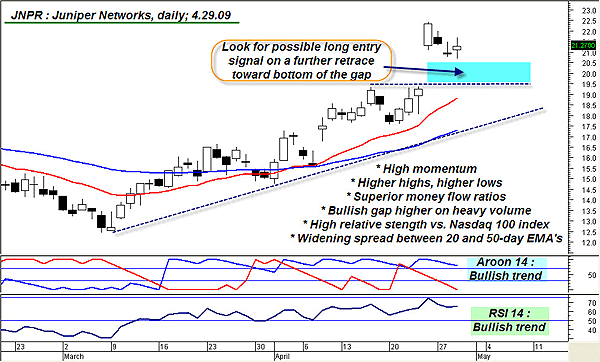
| Juniper Networks (JNPR) ranks #2 in relative strength versus the .NDX and also has a number of extremely positive technical factors in its favor (Figure 3). A continuing series of higher highs and higher lows is in effect; the Aroon (14) indicator is firmly in the bullish zone, the price recently gapped higher on high volume, and the uptrending RSI (14) indicator is well above 50, meaning that it too is confirming that a powerful trend move is under way. Then too the widening spread between the 20- and 50-day exponential moving average (EMAs) is yet another measure of bullish momentum. Finally, JNPR's money flow (not shown) is exceptionally bullish. Altogether, this looks like a good pullback against the trend entry setup, especially if the gap holds. |

|
| FIGURE 3: JNPR, DAILY. Superior trend, momentum, money flow, and relative strength characteristics could make JNPR an attractive long pullback entry trade in the next few sessions. |
| Graphic provided by: MetaStock. |
| |
| One indicator that seems to work well with a pullback entry is the stochRSI indicator, although a commodity channel index (CCI) or RSI set at 10-14 could also be put to work here. Regardless of the entry indicator, waiting for it to drop below its lower signal line, followed by a rise above that lower signal line, could be one way to get on board a potential reversal higher in JNPR. The first price target, should a suitable reversal entry materialize, is the prior swing high at $22.43. An initial sell-stop should be placed just below the reversal's low, bearing in mind that this should be viewed as a short-term swing trade. Bringing the stop up to breakeven once one (ATR 10) average true range of the past 10 days is achieved might also be a good idea, just in case the .NDX decides to start follow through and begin a full-scale corrective move, dragging JNPR along for the ride. |
Donald W. Pendergast is a financial markets consultant who offers specialized services to stock brokers and high net worth individuals who seek a better bottom line for their portfolios.
| Title: | Writer, market consultant |
| Company: | Linear Trading Systems LLC |
| Jacksonville, FL 32217 | |
| Phone # for sales: | 904-239-9564 |
| E-mail address: | lineartradingsys@gmail.com |
Traders' Resource Links | |
| Linear Trading Systems LLC has not added any product or service information to TRADERS' RESOURCE. | |
Click here for more information about our publications!
Comments
Date: 05/03/09Rank: 4Comment:

Request Information From Our Sponsors
- VectorVest, Inc.
- Executive Premier Workshop
- One-Day Options Course
- OptionsPro
- Retirement Income Workshop
- Sure-Fire Trading Systems (VectorVest, Inc.)
- Trading as a Business Workshop
- VectorVest 7 EOD
- VectorVest 7 RealTime/IntraDay
- VectorVest AutoTester
- VectorVest Educational Services
- VectorVest OnLine
- VectorVest Options Analyzer
- VectorVest ProGraphics v6.0
- VectorVest ProTrader 7
- VectorVest RealTime Derby Tool
- VectorVest Simulator
- VectorVest Variator
- VectorVest Watchdog
- StockCharts.com, Inc.
- Candle Patterns
- Candlestick Charting Explained
- Intermarket Technical Analysis
- John Murphy on Chart Analysis
- John Murphy's Chart Pattern Recognition
- John Murphy's Market Message
- MurphyExplainsMarketAnalysis-Intermarket Analysis
- MurphyExplainsMarketAnalysis-Visual Analysis
- StockCharts.com
- Technical Analysis of the Financial Markets
- The Visual Investor
