HOT TOPICS LIST
- MACD
- Fibonacci
- RSI
- Gann
- ADXR
- Stochastics
- Volume
- Triangles
- Futures
- Cycles
- Volatility
- ZIGZAG
- MESA
- Retracement
- Aroon
INDICATORS LIST
LIST OF TOPICS
PRINT THIS ARTICLE
by Koos van der Merwe
The name is synonymous with computers. Charts are suggesting the company, recently in the doldrums, may have found a path upward.
Position: Buy
Koos van der Merwe
Has been a technical analyst since 1969, and has worked as a futures and options trader with First Financial Futures in Johannesburg, South Africa.
PRINT THIS ARTICLE
ROUND TOP & BOTTOM
DELL Recovery May Be On Horizon
04/30/09 09:09:22 AMby Koos van der Merwe
The name is synonymous with computers. Charts are suggesting the company, recently in the doldrums, may have found a path upward.
Position: Buy
| Dell's new multitouch-capable, all-in-one Studio One 19 went on sale in the US. Will this be the secret of Dell's recovery, innovation and, of course, the fact that founder Michael Dell is once again more involved in the company ... a lesson learned from Apple Inc.? |

|
| FIGURE 1: DELL, MONTHLY |
| Graphic provided by: AdvancedGET. |
| |
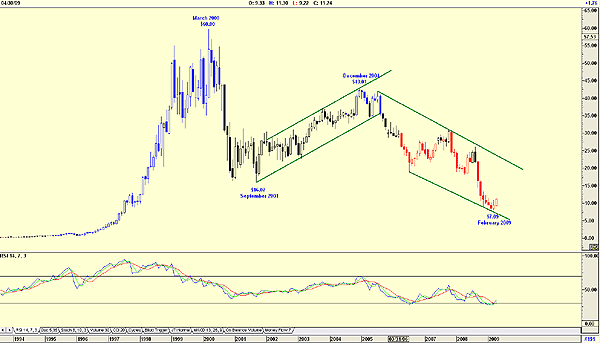
| Figure 1, a monthly chart of Dell, shows how the price reached a high of $60 in March 2000, and then fell as the technology bubble burst, the stock dropping to $16.02 by September 2001. The stock price then recovered with the market's recovery to $43.01 by December 2004, and after forming a double top, fell to a low of $7.09 by February 2009. Now, the question is, with money tight as consumers cut back on spending, what are the chances that new computers will be a priority and will lead to Dell's strong recovery? The answer, of course, is touch-screen technology. With the Windows 7 operating system allowing the technology first employed in the Apple iPod to be mainstream, and with Dell designing screens that apply this technology, computer geeks may trade in their existing computers for the new Dell multitouch computers. In any case, the market seems to be anticipating something of a strong recovery in DELL, and this can be seen in Figure 2. |

|
| FIGURE 2: DELL, DAILY |
| Graphic provided by: AdvancedGET. |
| |
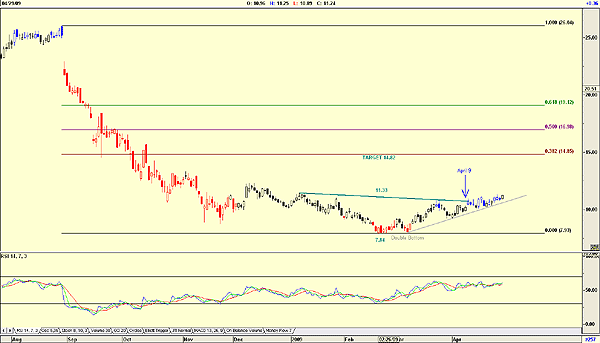
| The daily chart shows that DELL appears to be forming a large saucer formation with a low forming a double bottom at $7.84. I have drawn a resistance line along strong pivot points, which was penetrated on April 9. This suggests a target of $14.82, as shown on the chart. Fibonacci retracement levels, however, do suggest the following targets: $14.85 (38.2%); $16.98 (50%); and $19.12 (61.8%). The relative strength index (RSI) shown is showing strength, but it has not been that successful in its timing, having given a buy signal far too early. With the merry month of May around the corner, the maxim "Sell in May and go away" is on everyone's mind but in these recessionary times, it may be a wash and not happen at all. With Dell's new multitouch-capable, all-in-one Studio One 19 now on sale, we could buy DELL for a long-term hold. |
Has been a technical analyst since 1969, and has worked as a futures and options trader with First Financial Futures in Johannesburg, South Africa.
| Address: | 3256 West 24th Ave |
| Vancouver, BC | |
| Phone # for sales: | 6042634214 |
| E-mail address: | petroosp@gmail.com |
Click here for more information about our publications!
Comments
Date: 05/03/09Rank: 4Comment:
Date: 05/05/09Rank: 4Comment:

Request Information From Our Sponsors
- StockCharts.com, Inc.
- Candle Patterns
- Candlestick Charting Explained
- Intermarket Technical Analysis
- John Murphy on Chart Analysis
- John Murphy's Chart Pattern Recognition
- John Murphy's Market Message
- MurphyExplainsMarketAnalysis-Intermarket Analysis
- MurphyExplainsMarketAnalysis-Visual Analysis
- StockCharts.com
- Technical Analysis of the Financial Markets
- The Visual Investor
- VectorVest, Inc.
- Executive Premier Workshop
- One-Day Options Course
- OptionsPro
- Retirement Income Workshop
- Sure-Fire Trading Systems (VectorVest, Inc.)
- Trading as a Business Workshop
- VectorVest 7 EOD
- VectorVest 7 RealTime/IntraDay
- VectorVest AutoTester
- VectorVest Educational Services
- VectorVest OnLine
- VectorVest Options Analyzer
- VectorVest ProGraphics v6.0
- VectorVest ProTrader 7
- VectorVest RealTime Derby Tool
- VectorVest Simulator
- VectorVest Variator
- VectorVest Watchdog
