HOT TOPICS LIST
- MACD
- Fibonacci
- RSI
- Gann
- ADXR
- Stochastics
- Volume
- Triangles
- Futures
- Cycles
- Volatility
- ZIGZAG
- MESA
- Retracement
- Aroon
INDICATORS LIST
LIST OF TOPICS
PRINT THIS ARTICLE
by Chaitali Mohile
The bearish breakout of Valhi Inc. is inevitable.
Position: N/A
Chaitali Mohile
Active trader in the Indian stock markets since 2003 and a full-time writer. Trading is largely based upon technical analysis.
PRINT THIS ARTICLE
WEDGE FORMATIONS
VHI Ready To Decline
04/30/09 01:24:20 PMby Chaitali Mohile
The bearish breakout of Valhi Inc. is inevitable.
Position: N/A
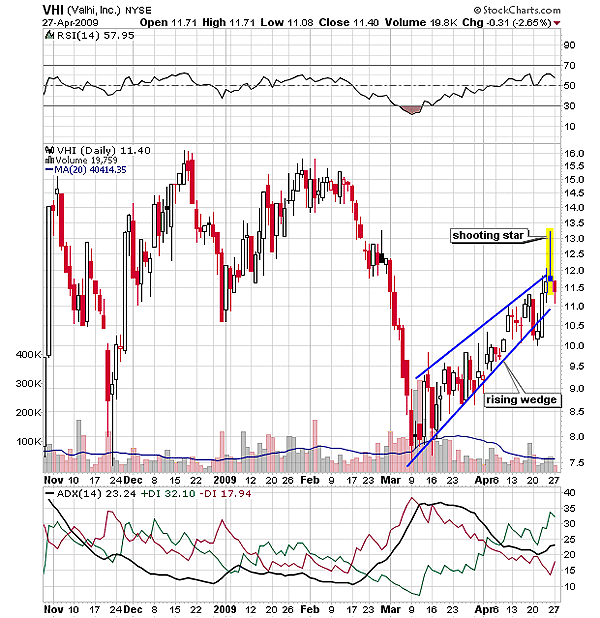
| After a huge correction, Valhi Inc. (VHI) was undergoing a fresh bullish rally from a new low of $7.50. An oversold relative strength index (RSI) (14) was one of reasons for the upward move. The developed downtrend in Figure 1 declined as the price shot upward. Although the stock rallied higher, the volume failed to increase with price. As a result, the rally turned volatile, forming many dojis and bearish candles during the upside price action. This formed a rising wedge reversal pattern as seen in Figure 1. |

|
| FIGURE 1: VHI, DAILY. The rising wedge and the shooting star formed would drag VHI to the previous lows. The breakout will be confirmed below the lower trendline of the wedge. |
| Graphic provided by: StockCharts.com. |
| |
| The rising wedge is a bearish reversal pattern that breaks downward. In this formation, the volume shrinks with rising price levels. The volume in Figure 1 has declined, confirming the rising wedge formation. The wedge is broad at the bottom and narrows as the stock moves higher in a narrow range. A shooting star on the daily chart reconfirms the downside breakout of VHI. This candlestick pattern is also a bearish reversal that appears at a peak of the rally. The shooting star indicates the end of the bullish rally. Therefore, in Figure 1 two bearish reversal patterns are formed -- the rising wedge and the shooting star. The candlestick pattern suggests that VHI is ready to break down. This will be confirmed when it breaks below the lower trendline support. |
| The RSI (14) has established support at the golden level of 50, but the indicator is reluctant to surge to the overbought area above 60, indicating lack of strength. If the momentum indicator slips below the 50 level, VHI may lose its entire gains on the previous bullish rally. The ADX (14) indicates a developing uptrend on average buying pressure. On these weak notes, VHI may drop down to the previous lows at $10. In addition, the financial markets across the world are likely to consolidate after the past robust bullish breakout. This consolidation may drag down a few weak stocks, and VHI could be one of them. |
Active trader in the Indian stock markets since 2003 and a full-time writer. Trading is largely based upon technical analysis.
| Company: | Independent |
| Address: | C1/3 Parth Indraprasth Towers. Vastrapur |
| Ahmedabad, Guj 380015 | |
| E-mail address: | chaitalimohile@yahoo.co.in |
Traders' Resource Links | |
| Independent has not added any product or service information to TRADERS' RESOURCE. | |
Click here for more information about our publications!
Comments
Date: 05/03/09Rank: 4Comment:

Request Information From Our Sponsors
- VectorVest, Inc.
- Executive Premier Workshop
- One-Day Options Course
- OptionsPro
- Retirement Income Workshop
- Sure-Fire Trading Systems (VectorVest, Inc.)
- Trading as a Business Workshop
- VectorVest 7 EOD
- VectorVest 7 RealTime/IntraDay
- VectorVest AutoTester
- VectorVest Educational Services
- VectorVest OnLine
- VectorVest Options Analyzer
- VectorVest ProGraphics v6.0
- VectorVest ProTrader 7
- VectorVest RealTime Derby Tool
- VectorVest Simulator
- VectorVest Variator
- VectorVest Watchdog
- StockCharts.com, Inc.
- Candle Patterns
- Candlestick Charting Explained
- Intermarket Technical Analysis
- John Murphy on Chart Analysis
- John Murphy's Chart Pattern Recognition
- John Murphy's Market Message
- MurphyExplainsMarketAnalysis-Intermarket Analysis
- MurphyExplainsMarketAnalysis-Visual Analysis
- StockCharts.com
- Technical Analysis of the Financial Markets
- The Visual Investor
