HOT TOPICS LIST
- MACD
- Fibonacci
- RSI
- Gann
- ADXR
- Stochastics
- Volume
- Triangles
- Futures
- Cycles
- Volatility
- ZIGZAG
- MESA
- Retracement
- Aroon
INDICATORS LIST
LIST OF TOPICS
PRINT THIS ARTICLE
by David Penn
After plunging from 115 to less than 55 in three months at the beginning of the year, shares of InfoSys are still trying to find a bottom. The developing descending triangle may help.
Position: N/A
David Penn
Technical Writer for Technical Analysis of STOCKS & COMMODITIES magazine, Working-Money.com, and Traders.com Advantage.
PRINT THIS ARTICLE
TRIANGLES
InfoSys Searches for a Bottom
08/30/01 03:30:44 PMby David Penn
After plunging from 115 to less than 55 in three months at the beginning of the year, shares of InfoSys are still trying to find a bottom. The developing descending triangle may help.
Position: N/A
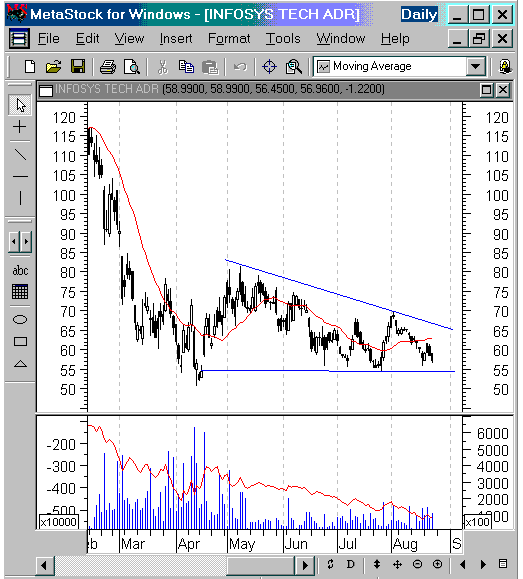
| Losing 52% of their value in three months, shares of InfoSys (INFY) have been as battered as any in the tech stock wreckyard. And it is true that looking for additional downside in a stock that has already shed more than half of its value may be, at best, a little excessive and, at worst, downright ruthless. But the case of INFY provides an opportunity not only to gain from the stock's decline, but also to check and see whether or not the lows already reached represent a bottom. |
| Much is made of false breakouts, when prices move in the opposite direction that a particular formation suggests is likely. But there are instances in which false breakouts can be especially revealing. Here, where INFY has developed into a descending triangle after a major decline, it is relatively easy to note what a downside breakout might mean: a test of the April lows and, given the already 52% drop, a possible end to the declines. |

|
| Downside breakout or bottom? A move in either direction could be profitable for the alert trader. |
| Graphic provided by: MetaStock. |
| |
| However, should INFY breakout on the upside, breaking through the downwardly sloping trendline on the top of the formation, then it would be reasonable to guess that the four-month descending triangle (which would have turned into a rectangle by this time) in actuality represented the bottom in INFY. Note that there is very little resistance above the high point of the formation, namely, the high of about 82 reached early in May. In fact, there are gaps at both 85 and 103 that were created during the rapid declines that INFY experienced during the beginning of the year. It is also possible to see how an INFY rally to 80 (which would require both the mentioned trendline break and working through the price congestion in May) could help establish a double bottom in the stock (the first bottom low being about 52 in April). Such a development would also underscore the notion that a bottom had indeed been established. |
| But given the prevailing downtrend and the enduring bearishness of the market for technology stocks, it seems like a downside breakout in INFY is the more likely move in the short term. As a descending triangle, the present pattern appears sound: volume is larger at the beginning of the formation compared to the end, the sloping and horizontal trendlines have both been tested--establishing the minor highs and lows that a real breakout will have to move beyond, preferably on large volume. |
| As of this writing, INFY is trading at about 54, just beneath the horizontal support line at 55. Given the size of the descending triangle--almost 20 points from horizontal support to the early May peak--a downside of as much as 35 could be expected. Even for those conservative pattern recognition traders who prefer to halve standard measurement rules, a 10 point downside break in INFY could represent an 18% gain, a great return in any market, let alone this one. |
Technical Writer for Technical Analysis of STOCKS & COMMODITIES magazine, Working-Money.com, and Traders.com Advantage.
| Title: | Technical Writer |
| Company: | Technical Analysis, Inc. |
| Address: | 4757 California Avenue SW |
| Seattle, WA 98116 | |
| Phone # for sales: | 206 938 0570 |
| Fax: | 206 938 1307 |
| Website: | www.Traders.com |
| E-mail address: | DPenn@traders.com |
Traders' Resource Links | |
| Charting the Stock Market: The Wyckoff Method -- Books | |
| Working-Money.com -- Online Trading Services | |
| Traders.com Advantage -- Online Trading Services | |
| Technical Analysis of Stocks & Commodities -- Publications and Newsletters | |
| Working Money, at Working-Money.com -- Publications and Newsletters | |
| Traders.com Advantage -- Publications and Newsletters | |
| Professional Traders Starter Kit -- Software | |
Click here for more information about our publications!
Comments
Date: 09/16/01Rank: 5Comment:

Request Information From Our Sponsors
- StockCharts.com, Inc.
- Candle Patterns
- Candlestick Charting Explained
- Intermarket Technical Analysis
- John Murphy on Chart Analysis
- John Murphy's Chart Pattern Recognition
- John Murphy's Market Message
- MurphyExplainsMarketAnalysis-Intermarket Analysis
- MurphyExplainsMarketAnalysis-Visual Analysis
- StockCharts.com
- Technical Analysis of the Financial Markets
- The Visual Investor
- VectorVest, Inc.
- Executive Premier Workshop
- One-Day Options Course
- OptionsPro
- Retirement Income Workshop
- Sure-Fire Trading Systems (VectorVest, Inc.)
- Trading as a Business Workshop
- VectorVest 7 EOD
- VectorVest 7 RealTime/IntraDay
- VectorVest AutoTester
- VectorVest Educational Services
- VectorVest OnLine
- VectorVest Options Analyzer
- VectorVest ProGraphics v6.0
- VectorVest ProTrader 7
- VectorVest RealTime Derby Tool
- VectorVest Simulator
- VectorVest Variator
- VectorVest Watchdog
