HOT TOPICS LIST
- MACD
- Fibonacci
- RSI
- Gann
- ADXR
- Stochastics
- Volume
- Triangles
- Futures
- Cycles
- Volatility
- ZIGZAG
- MESA
- Retracement
- Aroon
INDICATORS LIST
LIST OF TOPICS
PRINT THIS ARTICLE
by Chaitali Mohile
The S&P 500 Large Cap was undergoing a bullish rally. Recently, the index has hit the previous high resistance.
Position: N/A
Chaitali Mohile
Active trader in the Indian stock markets since 2003 and a full-time writer. Trading is largely based upon technical analysis.
PRINT THIS ARTICLE
SUPPORT & RESISTANCE
Large-Cap Index Near Resistance
04/29/09 01:47:39 PMby Chaitali Mohile
The S&P 500 Large Cap was undergoing a bullish rally. Recently, the index has hit the previous high resistance.
Position: N/A
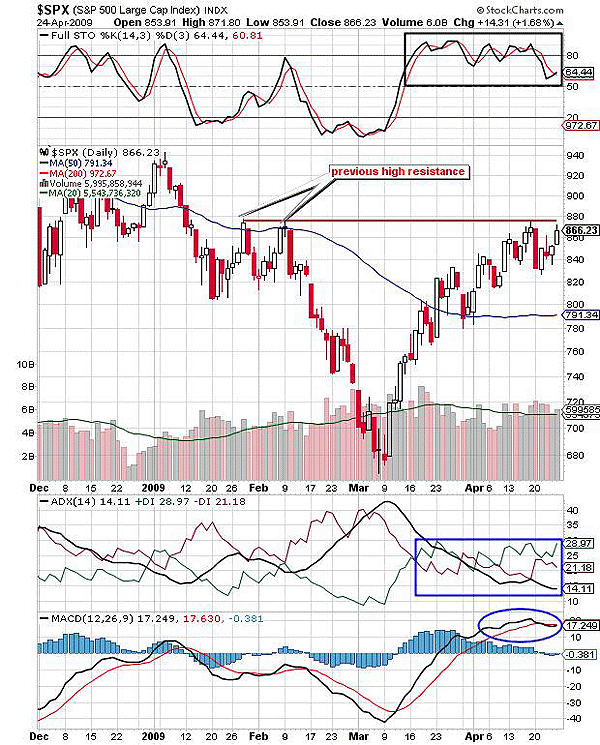
| The highly bearish conditions on the technical charts initiated a bullish rally in the S&P 500 Large Cap Index ($SPX). A long-legged doji of March 8 reflected indecision among the traders, and an inverted hammer on March 9 weakened the bears. Since the doji and an inverted hammer are single candlestick patterns, we need more confirmation from the indicators. The full stochastic (14,3,3) was highly oversold in March in Figure 1. The average directional movement index (ADX) (14) indicated overheated downtrend and the moving average convergence/divergence (MACD) (12,26,9) was negative before undergoing a bullish crossover. Therefore, all three indicators were highly bearish, suggesting a trend reversal scenario. Thus, the candlestick formations in Figure 1 were reconfirmed by the momentum oscillators, and the new upward rally born. |

|
| FIGURE 1: $SPX, DAILY. The index has reached the previous highs of January and February. The resistance is likely to suppress the bullish rally and may lead to consolidation. |
| Graphic provided by: StockCharts.com. |
| |
| The $SPX bullish rally in Figure 1 was well supported by encouraging volume. The consolidation during an upward action signified the strength in the rally. The index steadily moved higher as the overheated downtrend declined. The MACD (12,26,9) surged in positive territory, and the stochastic oscillator turned overbought. But the shaky stochastic movement near 80 levels was not a convincing sign for the bullish rally to run higher. Eventually, the $SPX reached the previous highs of mid-January and early February. After retracing below 840 levels on April 20, the index is consolidating under the previous high resistance. |
| The trend has turned weaker by moving below 15 levels, and the positive and the negative directional index (+DI) (-DI) are moving with equal pace. Thus, the ADX (14) is suggesting consolidation for $SPX. However, the other two oscillators are healthily bullish, so no significant downfall is indicated on the daily chart in Figure 1. The index is likely to consolidate in the range of 880 and 820 levels. |

|
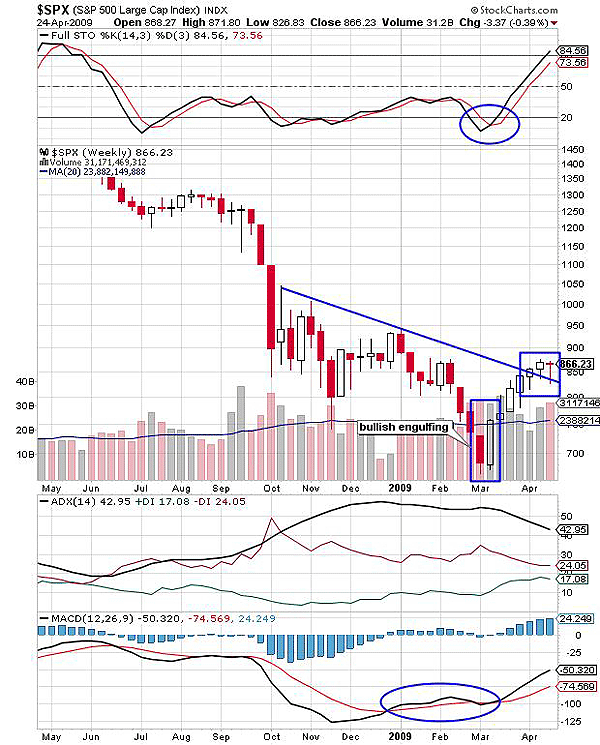
| FIGURE 2: $SPX, WEEKLY. The declining trendline shows the potential support level for the index. |
| Graphic provided by: StockCharts.com. |
| |
| In Figure 2, we can see that a bullish engulfing candlestick pattern reversed the bearish rally. Thereafter, the index rallied toward the previous highs. The bullish reversal candlestick pattern was accompanied by an oversold stochastic and the overheated downtrend. We can see that the ADX (14) was overheated since December 2008, but the indicator started declining only after March 2009. Therefore, we can conclude that an overheated downtrend initiated the bullish rally. |
| As the $SPX traveled higher, the rally formed two hanging man patterns; see the blue marked square in Figure 2. This indicated that the upside move is exhausting, although the full stochastic (14,3,3) is rallying vertically toward an overbought region. Recently, the index has formed a red doji, the color indicating bearishness of the candlestick pattern. The ADX (14) is still declining from the overheated levels, and the MACD (12,26,9) is positive in negative territory in Figure 2. Hence, the combination of indicators point to a consolidation rather than a huge decline for $SPX. The declining trendline shows support at approximately 820 levels for the consolidation range. |
Active trader in the Indian stock markets since 2003 and a full-time writer. Trading is largely based upon technical analysis.
| Company: | Independent |
| Address: | C1/3 Parth Indraprasth Towers. Vastrapur |
| Ahmedabad, Guj 380015 | |
| E-mail address: | chaitalimohile@yahoo.co.in |
Traders' Resource Links | |
| Independent has not added any product or service information to TRADERS' RESOURCE. | |
Click here for more information about our publications!
Comments
Date: 04/29/09Rank: 3Comment:

Request Information From Our Sponsors
- StockCharts.com, Inc.
- Candle Patterns
- Candlestick Charting Explained
- Intermarket Technical Analysis
- John Murphy on Chart Analysis
- John Murphy's Chart Pattern Recognition
- John Murphy's Market Message
- MurphyExplainsMarketAnalysis-Intermarket Analysis
- MurphyExplainsMarketAnalysis-Visual Analysis
- StockCharts.com
- Technical Analysis of the Financial Markets
- The Visual Investor
- VectorVest, Inc.
- Executive Premier Workshop
- One-Day Options Course
- OptionsPro
- Retirement Income Workshop
- Sure-Fire Trading Systems (VectorVest, Inc.)
- Trading as a Business Workshop
- VectorVest 7 EOD
- VectorVest 7 RealTime/IntraDay
- VectorVest AutoTester
- VectorVest Educational Services
- VectorVest OnLine
- VectorVest Options Analyzer
- VectorVest ProGraphics v6.0
- VectorVest ProTrader 7
- VectorVest RealTime Derby Tool
- VectorVest Simulator
- VectorVest Variator
- VectorVest Watchdog
