HOT TOPICS LIST
- MACD
- Fibonacci
- RSI
- Gann
- ADXR
- Stochastics
- Volume
- Triangles
- Futures
- Cycles
- Volatility
- ZIGZAG
- MESA
- Retracement
- Aroon
INDICATORS LIST
LIST OF TOPICS
PRINT THIS ARTICLE
by Donald W. Pendergast, Jr.
Keeping an eye on a stock's money flow trend can help you identify market turning points well in advance.
Position: N/A
Donald W. Pendergast, Jr.
Donald W. Pendergast is a financial markets consultant who offers specialized services to stock brokers and high net worth individuals who seek a better bottom line for their portfolios.
PRINT THIS ARTICLE
ACCUM./DIST. CHAIKIN
Sturm Ruger And Keeping Money Flow In The Crosshairs
04/29/09 08:47:11 AMby Donald W. Pendergast, Jr.
Keeping an eye on a stock's money flow trend can help you identify market turning points well in advance.
Position: N/A
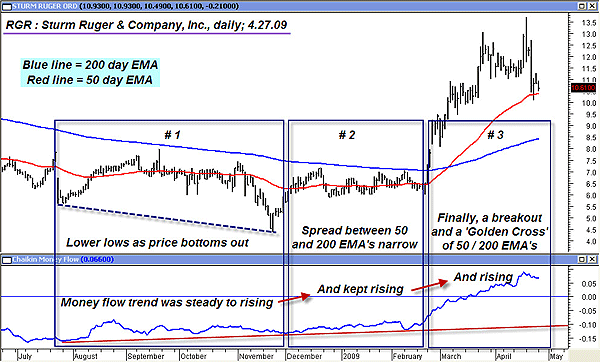
| Sturm Ruger & Co. (RGR) common stock has been on a rampage lately, nearly tripling in value from late November 2008 until early April 2009. Savvy traders who were monitoring the accumulation/distribution and money flow trends in RGR already knew that a turnaround was due, long before the price finally broke out and followed through with a sharp rally in February 2009. A review of RGR's daily chart (Figure 1) may help us better understand some of the dynamics surrounding such powerful market reversals. |

|
| FIGURE 1: RGR, DAILY. Easy as 1-2-3? Sometimes it's not as clean as this, but you'll be surprised at how using a long-term money flow indicator (CMF)(200) in conjunction with the 50- and 200-day EMA spread and crossover characteristics can help you get positioned for trend reversal and trend continuation movies. |
| Graphic provided by: MetaStock. |
| |
| This daily graph of RGR features two of the most important moving averages, the 50- and 200-period exponential moving averages (EMAs). At the bottom of the chart is the Chaikin money flow indicator (CMF); it's set at 200 periods to gain a better view of the longer-term money flow trend. Starting at the left side of the chart, take a gander at the leftmost highlighted box. Note that even though the price made a lower low, the money flow remained steady and began to rise by the time the final low was made. That was the first tipoff that the stock might have had an appointment with a major reversal, but that was simply the first confirmation. Moving to the right, the center box focuses on another sign of an impending trend reversal. Even though prices were consolidating at this point, the money flow kept on rising and the spread between the two moving averages began to narrow at a noticeable pace. Finally, at the third box, the big payoff — a significant breakout from the consolidation, one followed by a "golden cross" of the 200-day EMA by the 50-day EMA. Traders familiar with this money flow/EMA trend reversal method would likely have already been waiting for an entry trigger from their favorite daily based trading system near the end of the center box. Predictably, the money flow continued to rise, confirming the massive runup toward the $14 area. Of course, not every trade based on these principles works out this well, but using a long-term money flow indicator (like the CMF 200 or the accumulation/distribution indicator) in conjunction with the 50- and 200-day EMA pair will frequently help you identify potential reversal areas far in advance of most other traders. |
| Now that the golden cross has already occurred, the most favorable daily based trade setups are more likely to be found on the long side of this particular market. Historically, the golden cross system is in and of itself profitable when traded on a diverse portfolio of stocks, so fine-tuning your long entries by using a more focused shorter-term system to make your long trades after the golden cross is in effect could be a great way to help improve your trading account's performance. |
Donald W. Pendergast is a financial markets consultant who offers specialized services to stock brokers and high net worth individuals who seek a better bottom line for their portfolios.
| Title: | Writer, market consultant |
| Company: | Linear Trading Systems LLC |
| Jacksonville, FL 32217 | |
| Phone # for sales: | 904-239-9564 |
| E-mail address: | lineartradingsys@gmail.com |
Traders' Resource Links | |
| Linear Trading Systems LLC has not added any product or service information to TRADERS' RESOURCE. | |
Click here for more information about our publications!
Comments
Date: 04/29/09Rank: 5Comment:

Request Information From Our Sponsors
- StockCharts.com, Inc.
- Candle Patterns
- Candlestick Charting Explained
- Intermarket Technical Analysis
- John Murphy on Chart Analysis
- John Murphy's Chart Pattern Recognition
- John Murphy's Market Message
- MurphyExplainsMarketAnalysis-Intermarket Analysis
- MurphyExplainsMarketAnalysis-Visual Analysis
- StockCharts.com
- Technical Analysis of the Financial Markets
- The Visual Investor
- VectorVest, Inc.
- Executive Premier Workshop
- One-Day Options Course
- OptionsPro
- Retirement Income Workshop
- Sure-Fire Trading Systems (VectorVest, Inc.)
- Trading as a Business Workshop
- VectorVest 7 EOD
- VectorVest 7 RealTime/IntraDay
- VectorVest AutoTester
- VectorVest Educational Services
- VectorVest OnLine
- VectorVest Options Analyzer
- VectorVest ProGraphics v6.0
- VectorVest ProTrader 7
- VectorVest RealTime Derby Tool
- VectorVest Simulator
- VectorVest Variator
- VectorVest Watchdog
