HOT TOPICS LIST
- MACD
- Fibonacci
- RSI
- Gann
- ADXR
- Stochastics
- Volume
- Triangles
- Futures
- Cycles
- Volatility
- ZIGZAG
- MESA
- Retracement
- Aroon
INDICATORS LIST
LIST OF TOPICS
PRINT THIS ARTICLE
by James Kupfer
The last few weeks have brought little clarity to the direction for the Dow Jones 30, but a trading range can still be useful.
Position: Hold
James Kupfer
Mr. Kupfer is a market professional and amateur stock market commentator. Disclosure: It is likely that Mr. Kupfer has or will enter a position in any security he writes about.
PRINT THIS ARTICLE
TREND-CHANNEL
The Dow Channel
04/27/09 09:36:48 AMby James Kupfer
The last few weeks have brought little clarity to the direction for the Dow Jones 30, but a trading range can still be useful.
Position: Hold
| Given the huge move in the DJ30 that began in May 2008, it is no surprise that the market has paused over the last few weeks to consolidate recent gains. But is this a pause in a rally that will continue, or is it another top in the market? Frankly, I have no clue, but a possible trading strategy to take advantage of whatever scenario plays out has presented itself. |
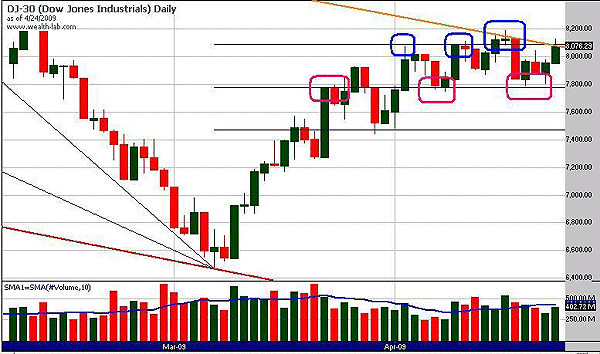
| A tight trading range has formed that can be used to help determine when a breakout eventually occurs. The blue ovals shown in Figure 1 show the previous resistance levels of the DJIA. These happen to correspond roughly to the 61.8% Fibonacci retracement level from the January 2009 high to the March low. The top end of the range is 8200. In pink, we can see the support levels at 7800 that occurred at the 50% Fibonacci retracement level. |

|
| FIGURE 1: DJIA, DAILY. Is this a rally that has paused or is it another top in the market? |
| Graphic provided by: Wealth-Lab. |
| |
| One of two things will eventually transpire: 1) The DJ will break above 8200, or 2) it will break below 7800. When one of these occurs, that will be the clearest indication we have gotten in weeks as to which direction that market will continue in for the short term. That will be the direction in which you should look to trade. |
Mr. Kupfer is a market professional and amateur stock market commentator. Disclosure: It is likely that Mr. Kupfer has or will enter a position in any security he writes about.
Click here for more information about our publications!
Comments
Date: 04/29/09Rank: 5Comment:

Request Information From Our Sponsors
- StockCharts.com, Inc.
- Candle Patterns
- Candlestick Charting Explained
- Intermarket Technical Analysis
- John Murphy on Chart Analysis
- John Murphy's Chart Pattern Recognition
- John Murphy's Market Message
- MurphyExplainsMarketAnalysis-Intermarket Analysis
- MurphyExplainsMarketAnalysis-Visual Analysis
- StockCharts.com
- Technical Analysis of the Financial Markets
- The Visual Investor
- VectorVest, Inc.
- Executive Premier Workshop
- One-Day Options Course
- OptionsPro
- Retirement Income Workshop
- Sure-Fire Trading Systems (VectorVest, Inc.)
- Trading as a Business Workshop
- VectorVest 7 EOD
- VectorVest 7 RealTime/IntraDay
- VectorVest AutoTester
- VectorVest Educational Services
- VectorVest OnLine
- VectorVest Options Analyzer
- VectorVest ProGraphics v6.0
- VectorVest ProTrader 7
- VectorVest RealTime Derby Tool
- VectorVest Simulator
- VectorVest Variator
- VectorVest Watchdog
