HOT TOPICS LIST
- MACD
- Fibonacci
- RSI
- Gann
- ADXR
- Stochastics
- Volume
- Triangles
- Futures
- Cycles
- Volatility
- ZIGZAG
- MESA
- Retracement
- Aroon
INDICATORS LIST
LIST OF TOPICS
PRINT THIS ARTICLE
by Chaitali Mohile
ICF International is likely to outperform.
Position: Buy
Chaitali Mohile
Active trader in the Indian stock markets since 2003 and a full-time writer. Trading is largely based upon technical analysis.
PRINT THIS ARTICLE
BREAKOUTS
ICF International Undergoes Healthy Breakout
04/28/09 11:25:23 AMby Chaitali Mohile
ICF International is likely to outperform.
Position: Buy
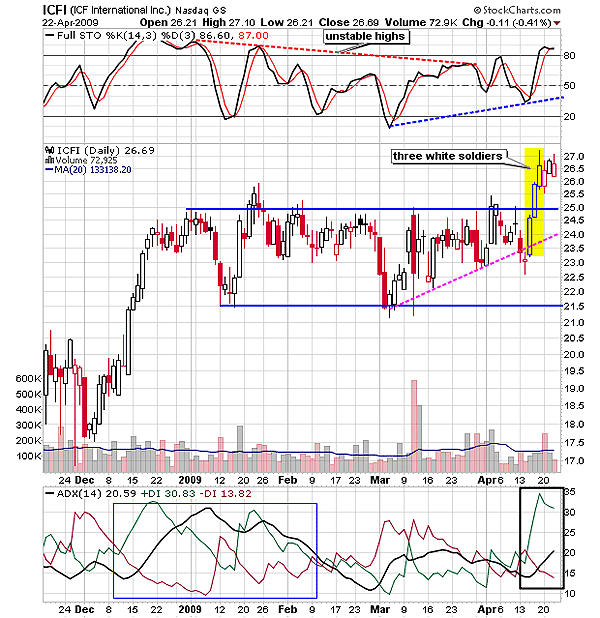
| After an exclusive advance rally in early December 2008, ICF International (ICFI) entered a long sideways move. The bullish rally initiated a fresh uptrend for ICFI. Although the uptrend was temporary, the average directional movement index (ADX) (14) shows that buying pressure did not drop drastically during consolidation. But the selling pressure was comparatively higher. The full stochastic (14,3,3) formed unstable highs, indicating large volatility. Therefore, ICFI consolidated in a wider range of $21.50 and $25. |

|
| FIGURE 1: ICFI, DAILY. After the robust trend reversal breakout, ICFI is consolidating in a narrow range of $27 and $26. |
| Graphic provided by: StockCharts.com. |
| |
| The three white soldiers' candlestick pattern breached the consolidation range. This candlestick pattern is a bullish trend reversal. We can see in Figure 1 that ICFI again entered the bullish trend after the breakout. The pattern is confirmed only if the second and the third candles open near the high or within the body of the previous candle. All the three candles in Figure 1 are bullish and each one opened near the high of the previous candle. After three consecutive bullish days, the rally was exhausted; as a result, the long upper shadow was visible on the third candle in Figure 1. The stock closed below the day's high, indicating weakness in the rally, so an upper shadow appeared on the third candle. Thereafter, ICFI changed direction and turned sideways. |
| Due to the breakout, the stock is likely to outperform other stocks. The sideways consolidation is forming a short-term bullish flag & pennant. Therefore, traders can initiate long trades above $27. The ADX (14) is indicating a developing uptrend, and the stochastic (14,3,3) has recently moved into an overbought zone. Thus, we can anticipate a huge upside rally above $27. |

|
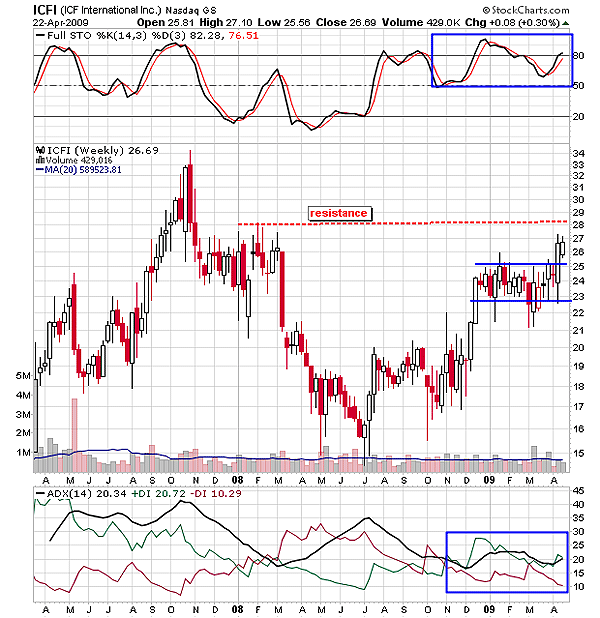
| FIGURE 2: ICFI, WEEKLY. The stock has been consolidating for more than three months. The breakout rally has immediate resistance at $28. |
| Graphic provided by: StockCharts.com. |
| |
| The weekly time frame shows a bullish flag & pennant formation in Figure 2. The consolidation from December to mid-April formed a flag and the advance rally of $5 (25 - 19) is the flagpole of the pattern. According to Figure 2, the pattern has already broken upward. An upper range of previous consolidation is the potential resistance for the current breakout rally. Under this scenario, ICFI would consolidate before undergoing a robust breakout above $28 (see the red dashed line). Traders with a long-term trading perspective can look for long positions above $28. ICFI has been in a developing uptrend since January 2009, and the stochastic oscillator is suggesting sufficient space for the upside price action. Therefore, traders can look for attractive trading opportunities. But short-term traders should follow the daily time frame. |
| The stock is gearing up for a robust breakout and if it happened it would outperform other stocks of the same category. |
Active trader in the Indian stock markets since 2003 and a full-time writer. Trading is largely based upon technical analysis.
| Company: | Independent |
| Address: | C1/3 Parth Indraprasth Towers. Vastrapur |
| Ahmedabad, Guj 380015 | |
| E-mail address: | chaitalimohile@yahoo.co.in |
Traders' Resource Links | |
| Independent has not added any product or service information to TRADERS' RESOURCE. | |
Click here for more information about our publications!
PRINT THIS ARTICLE

Request Information From Our Sponsors
- StockCharts.com, Inc.
- Candle Patterns
- Candlestick Charting Explained
- Intermarket Technical Analysis
- John Murphy on Chart Analysis
- John Murphy's Chart Pattern Recognition
- John Murphy's Market Message
- MurphyExplainsMarketAnalysis-Intermarket Analysis
- MurphyExplainsMarketAnalysis-Visual Analysis
- StockCharts.com
- Technical Analysis of the Financial Markets
- The Visual Investor
- VectorVest, Inc.
- Executive Premier Workshop
- One-Day Options Course
- OptionsPro
- Retirement Income Workshop
- Sure-Fire Trading Systems (VectorVest, Inc.)
- Trading as a Business Workshop
- VectorVest 7 EOD
- VectorVest 7 RealTime/IntraDay
- VectorVest AutoTester
- VectorVest Educational Services
- VectorVest OnLine
- VectorVest Options Analyzer
- VectorVest ProGraphics v6.0
- VectorVest ProTrader 7
- VectorVest RealTime Derby Tool
- VectorVest Simulator
- VectorVest Variator
- VectorVest Watchdog
