HOT TOPICS LIST
- MACD
- Fibonacci
- RSI
- Gann
- ADXR
- Stochastics
- Volume
- Triangles
- Futures
- Cycles
- Volatility
- ZIGZAG
- MESA
- Retracement
- Aroon
INDICATORS LIST
LIST OF TOPICS
PRINT THIS ARTICLE
by Chaitali Mohile
Allegiant Travel has been traveling north for the past few weeks.
Position: N/A
Chaitali Mohile
Active trader in the Indian stock markets since 2003 and a full-time writer. Trading is largely based upon technical analysis.
PRINT THIS ARTICLE
TECHNICAL ANALYSIS
A Giant Rally Of Allegiant Travel
04/28/09 11:13:50 AMby Chaitali Mohile
Allegiant Travel has been traveling north for the past few weeks.
Position: N/A
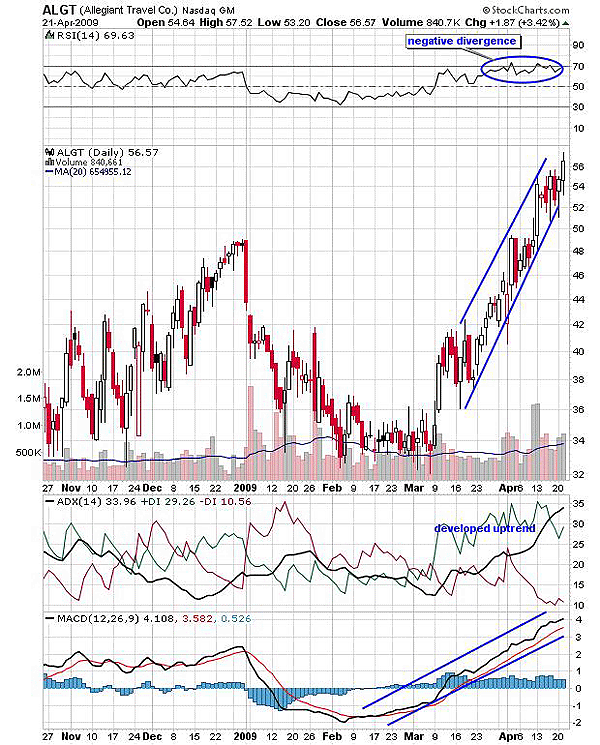
| Allegiant Travel Inc. (ALGT) began its upside journey in early March 2009. The relative strength index (RSI) breached the 50 level resistance and moved in a bullish area. ALGT gradually entered a new uptrend with the fresh bullish rally. The buying pressure indicated by the positive directional index (+DI) increased and the average directional index (ADX) (14) surged above 20 levels, indicating a developing uptrend. The rally continued to move higher with moderate volume. ALGT gained strength above $42 as the RSI (14) established support above 50 levels. In addition, the developed uptrend and the moving average convergence/divergence (MACD) (12,26,9) that slipped into positive territory accelerated the rally. |

|
| FIGURE 1: ALGT, DAILY. The negative divergence on the RSI (14) would result in a minor consolidation after the bullish session. The ADX (14) and MACD (12,26,9) are indicating a healthy upside rally. |
| Graphic provided by: StockCharts.com. |
| |
| Eventually, the stock hit a 52-week high on April 17. The developed uptrend turned robust, but the RSI (14) failed to make a new high. This developed a negative divergence, indicating volatility in the rally. The small candles as well as the bearish candles in Figure 1 signify the volatility. But the strong bullish force pulled ALGT higher, forming a rising wedge. However, we need to remember that any single direction rally is always dangerous. The low volume in Figure 1 reconfirms the rising wedge reversal formation. Although the pattern breaks in a bearish direction, the ADX (14) and the MACD (12,26,9) does not reveal any reversal indications. |

|
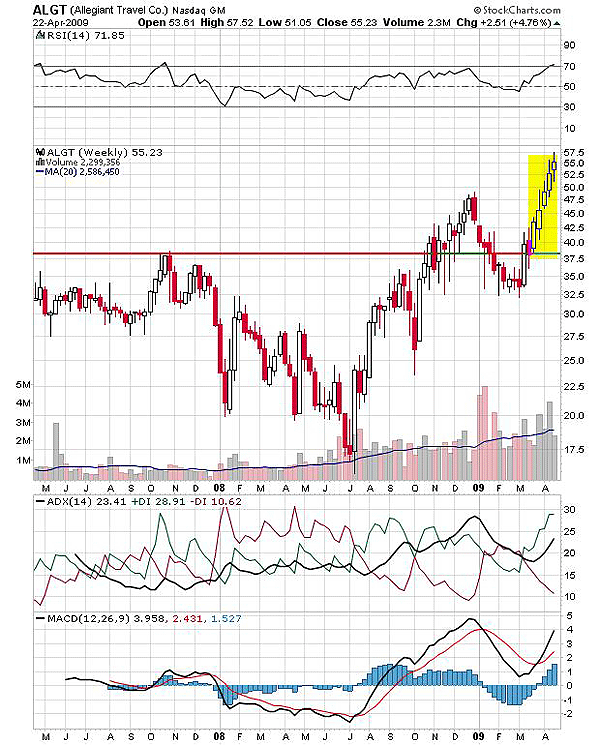
| FIGURE 2: ALGT, WEEKLY. The stock is well supported by the bullish indicators. Therefore, the rally has sufficient space to travel upward. |
| Graphic provided by: StockCharts.com. |
| |
| The support/resistance tool, the horizontal line, shows $37.50 as an important support area for the bullish rally in March. According to the yellow highlighted markings in Figure 2, the rally was unable to close near the weekly highs. The large upper shadows show a lack of bullish strength. The RSI (14) has suggested a weakness in the rally as well. Later, the momentum indicator made a new high in an overbought area. The ADX (14) is indicating a developing uptrend. |
| Therefore, in the long term the rally is likely to grow stronger. Due to the negative divergence on the daily time frame, the rally may consolidate after every bullish move. Traders can book profits during consolidation and reenter a long position as the stock breaks upward. |
Active trader in the Indian stock markets since 2003 and a full-time writer. Trading is largely based upon technical analysis.
| Company: | Independent |
| Address: | C1/3 Parth Indraprasth Towers. Vastrapur |
| Ahmedabad, Guj 380015 | |
| E-mail address: | chaitalimohile@yahoo.co.in |
Traders' Resource Links | |
| Independent has not added any product or service information to TRADERS' RESOURCE. | |
Click here for more information about our publications!
PRINT THIS ARTICLE

Request Information From Our Sponsors
- StockCharts.com, Inc.
- Candle Patterns
- Candlestick Charting Explained
- Intermarket Technical Analysis
- John Murphy on Chart Analysis
- John Murphy's Chart Pattern Recognition
- John Murphy's Market Message
- MurphyExplainsMarketAnalysis-Intermarket Analysis
- MurphyExplainsMarketAnalysis-Visual Analysis
- StockCharts.com
- Technical Analysis of the Financial Markets
- The Visual Investor
- VectorVest, Inc.
- Executive Premier Workshop
- One-Day Options Course
- OptionsPro
- Retirement Income Workshop
- Sure-Fire Trading Systems (VectorVest, Inc.)
- Trading as a Business Workshop
- VectorVest 7 EOD
- VectorVest 7 RealTime/IntraDay
- VectorVest AutoTester
- VectorVest Educational Services
- VectorVest OnLine
- VectorVest Options Analyzer
- VectorVest ProGraphics v6.0
- VectorVest ProTrader 7
- VectorVest RealTime Derby Tool
- VectorVest Simulator
- VectorVest Variator
- VectorVest Watchdog
