HOT TOPICS LIST
- MACD
- Fibonacci
- RSI
- Gann
- ADXR
- Stochastics
- Volume
- Triangles
- Futures
- Cycles
- Volatility
- ZIGZAG
- MESA
- Retracement
- Aroon
INDICATORS LIST
LIST OF TOPICS
PRINT THIS ARTICLE
by David Penn
After spending much of 2000 on the canvas, Procter and Gamble has spent much of 2001 fighting back.
Position: N/A
David Penn
Technical Writer for Technical Analysis of STOCKS & COMMODITIES magazine, Working-Money.com, and Traders.com Advantage.
PRINT THIS ARTICLE
DOUBLE BOTTOMS
Procter and Gamble's Double Bottom
08/24/01 02:32:00 PMby David Penn
After spending much of 2000 on the canvas, Procter and Gamble has spent much of 2001 fighting back.
Position: N/A
| While everyone was bemoaning the tragic fall of the dot-coms in the spring of 2000, far fewer noted the plummet of such tried 'n' true equities as Procter and Gamble, which began trading 2000 just north of 115, and finished the year trading closer to 55. That most of this decline happened in about eight trading days at the beginning of 2000 is all the more remarkable. Sure www.YesWeHaveNoProfits.com took a beating that spring. But the makers of Tide? Charmin? Pampers? Say it ain't so! |
| Such widespread equity devastation underscores the thoroughness of the bear market that hit stocks in 2000. And, true to form, this bear market seems to have seen the tossing out of the good with the bad. Procter and Gamble, unlike many of the dot-coms that went down with the ship, is clearly an example of the former and its recent price action, climbing from about 57 in April to trade just shy of 75 by August (a little less than 50% in four months) highlights the fact that PG may be worth saving. |

|
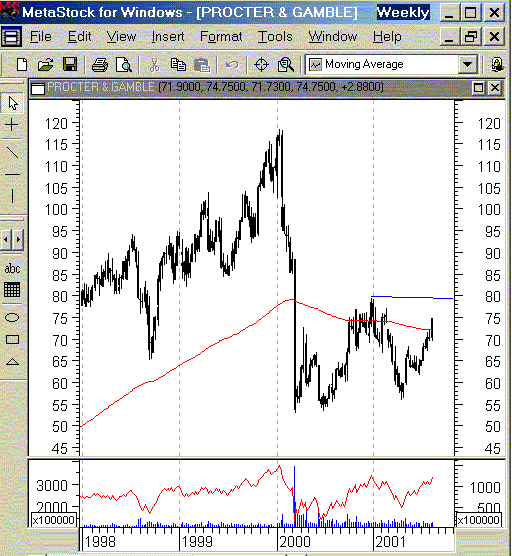
| Procter and Gamble looks to regain ground above its 200-day moving average in the second half of 2001. A successful breakout above the 79 area could anticipate even further gains. |
| Graphic provided by: MetaStock. |
| |
| Fortunately, PG appears to be well on its way to putting in a bottom. Although PG is now on its second attempt to break through 79 since the spring 2000 crash, the stock has successfully tested its lows twice since the crash. Its spring 2001 test, for example, was less vigorous than previous tests in the early summer of 2000, suggesting that PG may increasingly be able to hold onto price gains. Since May, PG has been in an ascending trend channel and is now only points away from an important resistance top reached in mid-December. |
| But it is the 18-month double bottom that provides the most confidence that Procter and Gamble might be on the road to recovery. The two troughs, one in the spring of 2000 and the other in the spring of 2001, form the pair of bottoms that mark the pattern. The double bottom formation is a classic bottom-forming pattern in which two major attempts to establish a new low are rebuffed. This failure to establish new lows is taken by all market participants--bulls and bears--as evidence that a bottom has already occurred and that the tradable's most profitable near-term movement is mostly likely upward. Double bottoms are confirmed when prices rally from the second bottom and break through a horizontal area marked by the highpoint of the rally between the two bottoms. While volume is generally higher on the left side of the double bottom than on the right, breakout volume for the formation is typically very high. |
| In the case of PG, a breakout area can be marked at 79, which again represents the peak between the two bottoms that occurred in December 2000. Given the size of the formation--the lower trough in the spring of 2000 reached a low of 54--an upside price target of as much as 105 would not be unexpected. This would set Procter and Gamble up for a possible retest of its all-time high of about 117. |
Technical Writer for Technical Analysis of STOCKS & COMMODITIES magazine, Working-Money.com, and Traders.com Advantage.
| Title: | Technical Writer |
| Company: | Technical Analysis, Inc. |
| Address: | 4757 California Avenue SW |
| Seattle, WA 98116 | |
| Phone # for sales: | 206 938 0570 |
| Fax: | 206 938 1307 |
| Website: | www.Traders.com |
| E-mail address: | DPenn@traders.com |
Traders' Resource Links | |
| Charting the Stock Market: The Wyckoff Method -- Books | |
| Working-Money.com -- Online Trading Services | |
| Traders.com Advantage -- Online Trading Services | |
| Technical Analysis of Stocks & Commodities -- Publications and Newsletters | |
| Working Money, at Working-Money.com -- Publications and Newsletters | |
| Traders.com Advantage -- Publications and Newsletters | |
| Professional Traders Starter Kit -- Software | |
Click here for more information about our publications!
Comments
Date: 08/24/01Rank: 5Comment:

Request Information From Our Sponsors
- StockCharts.com, Inc.
- Candle Patterns
- Candlestick Charting Explained
- Intermarket Technical Analysis
- John Murphy on Chart Analysis
- John Murphy's Chart Pattern Recognition
- John Murphy's Market Message
- MurphyExplainsMarketAnalysis-Intermarket Analysis
- MurphyExplainsMarketAnalysis-Visual Analysis
- StockCharts.com
- Technical Analysis of the Financial Markets
- The Visual Investor
- VectorVest, Inc.
- Executive Premier Workshop
- One-Day Options Course
- OptionsPro
- Retirement Income Workshop
- Sure-Fire Trading Systems (VectorVest, Inc.)
- Trading as a Business Workshop
- VectorVest 7 EOD
- VectorVest 7 RealTime/IntraDay
- VectorVest AutoTester
- VectorVest Educational Services
- VectorVest OnLine
- VectorVest Options Analyzer
- VectorVest ProGraphics v6.0
- VectorVest ProTrader 7
- VectorVest RealTime Derby Tool
- VectorVest Simulator
- VectorVest Variator
- VectorVest Watchdog
