HOT TOPICS LIST
- MACD
- Fibonacci
- RSI
- Gann
- ADXR
- Stochastics
- Volume
- Triangles
- Futures
- Cycles
- Volatility
- ZIGZAG
- MESA
- Retracement
- Aroon
INDICATORS LIST
LIST OF TOPICS
PRINT THIS ARTICLE
by Chaitali Mohile
Will the Energy Select Sector undergo a bullish breakout or drop down to previous lows?
Position: N/A
Chaitali Mohile
Active trader in the Indian stock markets since 2003 and a full-time writer. Trading is largely based upon technical analysis.
PRINT THIS ARTICLE
CONSOLID FORMATION
Energy Sector Consolidates
04/22/09 01:47:03 PMby Chaitali Mohile
Will the Energy Select Sector undergo a bullish breakout or drop down to previous lows?
Position: N/A
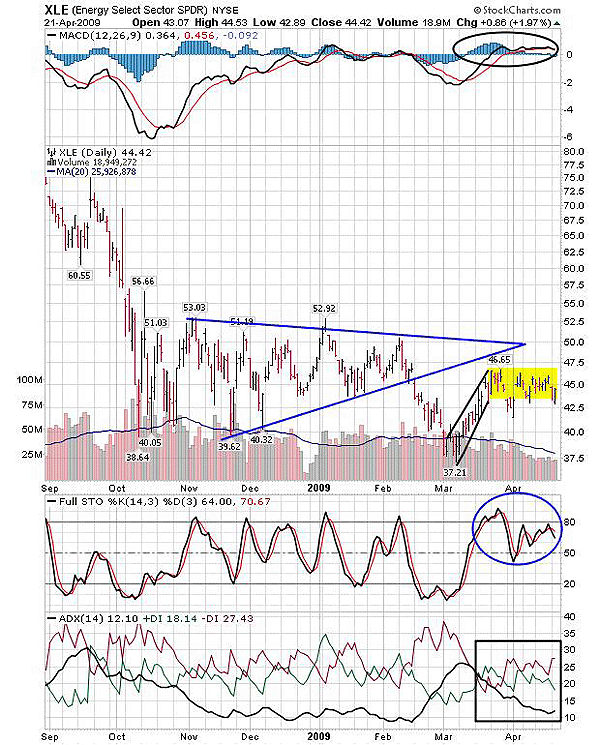
| The robust corrective phase dragged the Energy Select Sector (XLE) to a new low at $38.64. The volatile consolidation from the new low formed a long-term symmetrical triangle. Since the triangle took more than three months to mature, we consider this pattern to be long term, and the longer the pattern, the more reliable is the breakout. But the breakout direction of the symmetrical triangle cannot be anticipated in a bullish or bearish trend. In Figure 1, we can see that the pattern has broken downward and the rally made a new low at $37.21. |

|
| FIGURE 1: XLE, DAILY. The sector is consolidating after an extensive advance rally from the new low of $37.21. The bullish flag & pennant can be seen on this chart. |
| Graphic provided by: StockCharts.com. |
| |
| The average directional movement index (ADX) (14) that showed a weak trend and a volatile consolidation since October 2008 to February 2009 surged in favor of the bears. The selling pressure increased dramatically as the XLE witnessed bearish breakout of the symmetrical triangle. Although the ADX (14) moved above 20, indicating a developing downtrend, the indicator failed to climb higher than 25 as XLE established support at the new low. |
| The highly oversold stochastic (14,3,3) initiated a bullish rally of approximately $10 in March 2009. The moving average convergence/divergence (MACD) (12,26,9) rushed above the zero line and stabilized in positive territory. The price rally turned sideways after an advance rally, forming a bullish flag and pennant continuation pattern. The yellow marking in Figure 1 shows the flag formation. This pattern breaks in an upward direction, but the indicators on the daily time frame in Figure 1 are not suggesting any breakout. |
| The MACD (12,26,9) is moving horizontally with the support of the zero line. The stochastic is zigzagging in an overbought area between 50 and 80, and the ADX (14) is below 15, indicating consolidation. In addition, the positive and negative directional index (+DI) (-DI) have converged, suggesting equal buying and selling pressures. Therefore, the mixed scenario may not encourage the bullish breakout. In fact, XLE would continue its sideways movement till strong buying and positive momentum are reflected. During consolidation, the stock should essentially sustain above $42.5. The future breakout rally has the resistance of the converging trendlines of the symmetrical triangle and the previous highs. |
| Therefore, XLE would consolidate for a further period rather than undergoing a bullish breakout of the flag & pennant pattern. |
Active trader in the Indian stock markets since 2003 and a full-time writer. Trading is largely based upon technical analysis.
| Company: | Independent |
| Address: | C1/3 Parth Indraprasth Towers. Vastrapur |
| Ahmedabad, Guj 380015 | |
| E-mail address: | chaitalimohile@yahoo.co.in |
Traders' Resource Links | |
| Independent has not added any product or service information to TRADERS' RESOURCE. | |
Click here for more information about our publications!
Comments
Date: 04/29/09Rank: 3Comment:

Request Information From Our Sponsors
- StockCharts.com, Inc.
- Candle Patterns
- Candlestick Charting Explained
- Intermarket Technical Analysis
- John Murphy on Chart Analysis
- John Murphy's Chart Pattern Recognition
- John Murphy's Market Message
- MurphyExplainsMarketAnalysis-Intermarket Analysis
- MurphyExplainsMarketAnalysis-Visual Analysis
- StockCharts.com
- Technical Analysis of the Financial Markets
- The Visual Investor
- VectorVest, Inc.
- Executive Premier Workshop
- One-Day Options Course
- OptionsPro
- Retirement Income Workshop
- Sure-Fire Trading Systems (VectorVest, Inc.)
- Trading as a Business Workshop
- VectorVest 7 EOD
- VectorVest 7 RealTime/IntraDay
- VectorVest AutoTester
- VectorVest Educational Services
- VectorVest OnLine
- VectorVest Options Analyzer
- VectorVest ProGraphics v6.0
- VectorVest ProTrader 7
- VectorVest RealTime Derby Tool
- VectorVest Simulator
- VectorVest Variator
- VectorVest Watchdog
