HOT TOPICS LIST
- MACD
- Fibonacci
- RSI
- Gann
- ADXR
- Stochastics
- Volume
- Triangles
- Futures
- Cycles
- Volatility
- ZIGZAG
- MESA
- Retracement
- Aroon
INDICATORS LIST
LIST OF TOPICS
PRINT THIS ARTICLE
by Donald W. Pendergast, Jr.
After a successful test of a major low, EnerSys has risen more than 65% and now appears to be preparing for yet another move higher.
Position: Buy
Donald W. Pendergast, Jr.
Donald W. Pendergast is a financial markets consultant who offers specialized services to stock brokers and high net worth individuals who seek a better bottom line for their portfolios.
PRINT THIS ARTICLE
BREAKOUTS
EnerSys Sets Up For Possible Breakout
04/22/09 08:55:23 AMby Donald W. Pendergast, Jr.
After a successful test of a major low, EnerSys has risen more than 65% and now appears to be preparing for yet another move higher.
Position: Buy
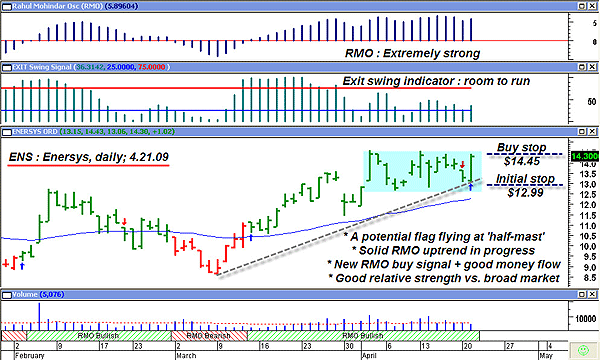
| Money flow. Support. Resistance. Retest. Relative strength. Breakout. Trade sizing and trade management. Perhaps there are more elements required to structure a profitable trading framework, but if there are, I doubt that they would be as essential as those mentioned. Figure 1, the daily chart of EnerSys (ENS), which is a company involved in the industrial battery business, features many of those key elements and, even better, also presents us with a fresh buy signal from one of the better systematic trading methods available. |

|
| FIGURE 1: ENS, DAILY. This looks like a very tradable long setup in a high relative strength stock with good earnings. Trade sizing and trade management, as in every case, is the real key to limiting losses and securing profits. |
| Graphic provided by: MetaStock. |
| |
| Early in March 2009, ENS completed a successful retest of its recent major low, one originally made in January 2009. Since then, the shares are up by more than 60% and appear to be on the verge of a potential bullish breakout from a well-defined flag pattern. The stock is in a general uptrend, its Rahul Mohindar (RMO) oscillator (top of chart) is demonstrating exceptional trend momentum, money flow (not shown) is positive and rising, the stock has above-average relative strength versus the broad market, and the RMO swing buy indicator has just issued a buy signal. Even better, one of the better-respected stock research/ranking outfits just placed ENS on its buy list today. Earnings are also good; in fact, ENS beat the street's earnings estimates by more than 50% last quarter. So what now? Let's look at a potential way to play this relatively low-risk long-trade setup, one that seems to have everything going its way. |
| The easiest and lowest-risk way to play ENS here is to buy half a position on a breakout and the balance on a possible 30-minute pullback back in the direction of the gray uptrend line, a line that can also function as an ad-hoc initial stop-loss. Overhead resistance lies near $16 and then $19.72, so this long setup has a potentially good risk-reward ratio, too. In fact, it's possible that ENS could actually see that $19.72 level based on the position of the flag within the current market structure of the chart. Realistically, any trader who can get the split fills described above (half on the break from the flag and half on an intraday pullback) should consider taking half profits if $16 is reached before being stopped out — at $16, bring the stop up to breakeven and then trail the whole deal with a two- to three-bar trailing stop of the lows. Further gains can be addressed as they materialize, if at all; better to grab at least a modest profit when it shows up than to end up as another trader with many regrets. Maybe something to think about, eh? |
Donald W. Pendergast is a financial markets consultant who offers specialized services to stock brokers and high net worth individuals who seek a better bottom line for their portfolios.
| Title: | Writer, market consultant |
| Company: | Linear Trading Systems LLC |
| Jacksonville, FL 32217 | |
| Phone # for sales: | 904-239-9564 |
| E-mail address: | lineartradingsys@gmail.com |
Traders' Resource Links | |
| Linear Trading Systems LLC has not added any product or service information to TRADERS' RESOURCE. | |
Click here for more information about our publications!
Comments
Date: 04/25/09Rank: 3Comment:

Request Information From Our Sponsors
- StockCharts.com, Inc.
- Candle Patterns
- Candlestick Charting Explained
- Intermarket Technical Analysis
- John Murphy on Chart Analysis
- John Murphy's Chart Pattern Recognition
- John Murphy's Market Message
- MurphyExplainsMarketAnalysis-Intermarket Analysis
- MurphyExplainsMarketAnalysis-Visual Analysis
- StockCharts.com
- Technical Analysis of the Financial Markets
- The Visual Investor
- VectorVest, Inc.
- Executive Premier Workshop
- One-Day Options Course
- OptionsPro
- Retirement Income Workshop
- Sure-Fire Trading Systems (VectorVest, Inc.)
- Trading as a Business Workshop
- VectorVest 7 EOD
- VectorVest 7 RealTime/IntraDay
- VectorVest AutoTester
- VectorVest Educational Services
- VectorVest OnLine
- VectorVest Options Analyzer
- VectorVest ProGraphics v6.0
- VectorVest ProTrader 7
- VectorVest RealTime Derby Tool
- VectorVest Simulator
- VectorVest Variator
- VectorVest Watchdog
