HOT TOPICS LIST
- MACD
- Fibonacci
- RSI
- Gann
- ADXR
- Stochastics
- Volume
- Triangles
- Futures
- Cycles
- Volatility
- ZIGZAG
- MESA
- Retracement
- Aroon
INDICATORS LIST
LIST OF TOPICS
PRINT THIS ARTICLE
by Mike Carr, CMT
The broad market has been up six weeks in a row. We look at what happens after a run like that and discover it's bearish and bullish.
Position: N/A
Mike Carr, CMT
Mike Carr, CMT, is a member of the Market Technicians Association, and editor of the MTA's newsletter, Technically Speaking. He is also the author of "Smarter Investing in Any Economy: The Definitive Guide to Relative Strength Investing," and "Conquering the Divide: How to Use Economic Indicators to Catch Stock Market Trends."
PRINT THIS ARTICLE
STRATEGIES
After Six Up Weeks In A Row ...
04/20/09 09:33:22 AMby Mike Carr, CMT
The broad market has been up six weeks in a row. We look at what happens after a run like that and discover it's bearish and bullish.
Position: N/A
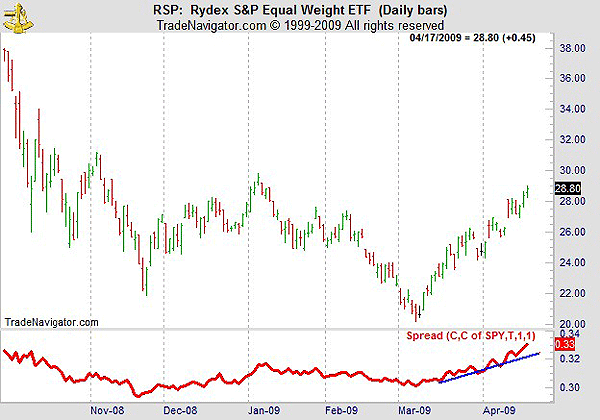
| Looking at the Value Line Index, stocks closed with their sixth consecutive week of gains. The Standard & Poor's 500 only shows five weeks of gains, but the Value Line provides a better measure of what the average stock is doing because it is a very broad, equal-weighted index. Figure 1 shows the relative strength of the S&P 500 against its equal-weighted counterpart, measured by the RSP, an exchange traded fund (ETF) that tracks the equal-weighted index. When RSP is doing better, the average stock is outperforming the S&P 500. |

|
| FIGURE 1: RSP, DAILY. From this chart, we can see that the relative strength of the equal-weighted index is greater than the S&P 500, indicating that small-cap stocks are outpacing large-cap stocks. |
| Graphic provided by: Trade Navigator. |
| |
| The Value Line has closed up six straight weeks 15 times since 1993, an average of almost once a year. It has been up seven consecutive weeks on six occasions. The longest streak is 10 weeks. So this recent behavior is unusual, but certainly not unprecedented. |
| After being up six weeks in a row, the chance that the index will close higher one week later is 40%, less than average. Two weeks later, the average closed higher 54.5% of the time, about average. Three weeks later, the odds of an up close were only 36.4%, indicating that a pullback is likely from current levels. However, a month later, the market was higher 70% of the time. |
| These odds offer insight into what to expect in the coming weeks. They may help traders assess whether we are in a bear market rally or have begun a new bull market. If it's a new bull, we should be higher four weeks from now. |
Mike Carr, CMT, is a member of the Market Technicians Association, and editor of the MTA's newsletter, Technically Speaking. He is also the author of "Smarter Investing in Any Economy: The Definitive Guide to Relative Strength Investing," and "Conquering the Divide: How to Use Economic Indicators to Catch Stock Market Trends."
| Website: | www.moneynews.com/blogs/MichaelCarr/id-73 |
| E-mail address: | marketstrategist@gmail.com |
Click here for more information about our publications!
Comments
Date: 04/20/09Rank: 1Comment:

Request Information From Our Sponsors
- StockCharts.com, Inc.
- Candle Patterns
- Candlestick Charting Explained
- Intermarket Technical Analysis
- John Murphy on Chart Analysis
- John Murphy's Chart Pattern Recognition
- John Murphy's Market Message
- MurphyExplainsMarketAnalysis-Intermarket Analysis
- MurphyExplainsMarketAnalysis-Visual Analysis
- StockCharts.com
- Technical Analysis of the Financial Markets
- The Visual Investor
- VectorVest, Inc.
- Executive Premier Workshop
- One-Day Options Course
- OptionsPro
- Retirement Income Workshop
- Sure-Fire Trading Systems (VectorVest, Inc.)
- Trading as a Business Workshop
- VectorVest 7 EOD
- VectorVest 7 RealTime/IntraDay
- VectorVest AutoTester
- VectorVest Educational Services
- VectorVest OnLine
- VectorVest Options Analyzer
- VectorVest ProGraphics v6.0
- VectorVest ProTrader 7
- VectorVest RealTime Derby Tool
- VectorVest Simulator
- VectorVest Variator
- VectorVest Watchdog
