HOT TOPICS LIST
- MACD
- Fibonacci
- RSI
- Gann
- ADXR
- Stochastics
- Volume
- Triangles
- Futures
- Cycles
- Volatility
- ZIGZAG
- MESA
- Retracement
- Aroon
INDICATORS LIST
LIST OF TOPICS
PRINT THIS ARTICLE
by Donald W. Pendergast, Jr.
Casey's General Stores stock scores high on both relative strength and fundamental factors, just as a new RMO buy signal prints on its daily chart.
Position: Buy
Donald W. Pendergast, Jr.
Donald W. Pendergast is a financial markets consultant who offers specialized services to stock brokers and high net worth individuals who seek a better bottom line for their portfolios.
PRINT THIS ARTICLE
BREAKOUTS
CASY Bullish Breakout Setup
04/20/09 09:25:04 AMby Donald W. Pendergast, Jr.
Casey's General Stores stock scores high on both relative strength and fundamental factors, just as a new RMO buy signal prints on its daily chart.
Position: Buy
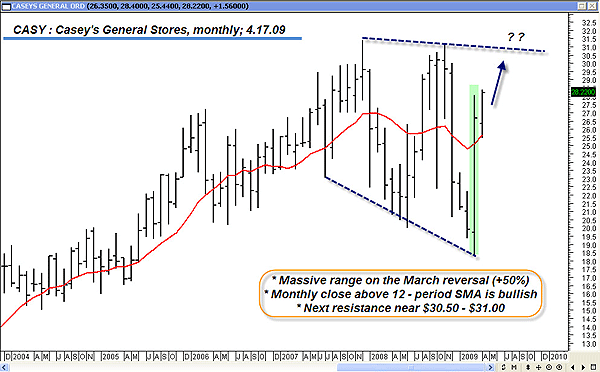
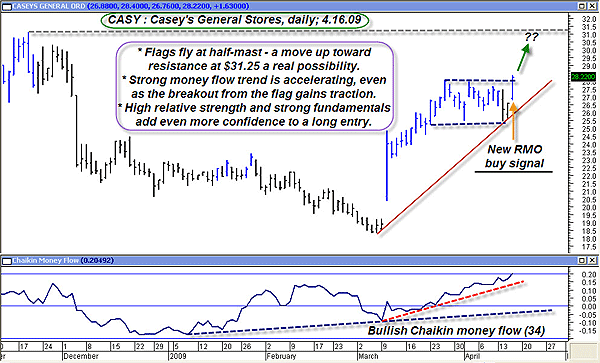
| Iowa–based Casey's General Stores (CASY) operates a large network of convenience stores across a number of Midwestern states. Since the early 1990s, the company's shares have been in a generally rising trend, the bear markets of 2000–02 and 2007–09 notwithstanding. A review of CASY's monthly chart comes first in Figure 1, followed by an analysis of its daily chart in Figure 2. |

|
| FIGURE 1: CASY, MONTHLY. This stock may be headed for the upper boundary of the huge broadening formation; the enormous range of the March 2009 monthly bar (+50%) is also noteworthy. |
| Graphic provided by: MetaStock. |
| |
| CASY's common stock has increased by approximately 2,400% since late 1990, despite several periods of consolidation or outright bear market retracement. Currently, the stock features a pattern of sustained earnings growth and is also outperforming the NASDAQ Composite Index by a wide margin. That's not too surprising, given that the shares are up by 54% in just the past six weeks. The stock also sports a price/earnings ratio of 16.05 and an annual dividend of 1.06%, with the current year earnings per share estimate coming in at close to $1.74 per share. There are a few items of note on the monthly chart (Figure 1); for one, the stock has recently closed above its 12-month simple moving average, a moving average used by some market pros to determine the current trend bias of a given stock or commodity. The most remarkable aspect of this time frame is the extraordinary range of last month's (March 2009) price range; this stock rose by 50% in the space of a single month. Currently, the stock is heading up toward the upper boundary of an enormous broadening wedge formation, one that has been developing since late 2007 to early 2008. Given the powerful fundamental and relative strength momentum under girding the stock, that upper boundary of the broadening formation could be reached fairly soon, a prospect that's sure to kindle the interest of momentum traders everywhere. Now, let's take a trip over to CASY's daily graph (Figure 2) for more specifics on a promising long trade setup. |

|
| FIGURE 2: CASY, DAILY. Strong money flows and a bullish breakout from a flag pattern take on added significance when a stock has strong earnings growth and relative strength characteristics. |
| Graphic provided by: MetaStock. |
| |
| The daily chart shows us the fresh breakout from a flag pattern, one that also triggered a fresh Rahul Mohindar (RMO) buy signal. This is an incredible breakout pattern, not just due to the RMO buy signal, but also due to the flag's relative placement between the March low and the overhead resistance area near $31.25. Most traders have heard of the old trader's saying, "Flags fly at half-mast," and this particular flag may be destined to produce a move that could actually cause that saying to come true. Given the strong fundamentals and relative strength, this looks like a long trade setup worth considering. |
| Impatient traders might consider putting on a full position on a break above today's (April 16) high near $28.40, but a better, safer move might be to put on half at that price and half on a possible 30-minute pullback toward the April 16th low. The rising trendline (red line) could serve as an initial stop, and, if the move continues higher, a two-bar trailing stop of the lows could help to protect your capital in case a sharp reversal occurs before reaching that resistance zone near $31.25. If the move kicks in, however, pulling half the position off near that overhead resistance would be a very wise strategy, no matter what else is going on with this stock. Finally, those trading 10- to 30-minute charts should be able to locate plenty of suitable long entry setups on a possible ride up toward $31.25, if they know what to look for. |
| Even in the depths of a crippling recession, some companies continue to grow their earnings, providing swing and intraday traders with numerous opportunities to trade from the long side. Keeping abreast of a stock's relative strength rankings (versus the broad market) and other fundamental factors can add an extra measure of depth to the technical setups you encounter in any given stock. |
Donald W. Pendergast is a financial markets consultant who offers specialized services to stock brokers and high net worth individuals who seek a better bottom line for their portfolios.
| Title: | Writer, market consultant |
| Company: | Linear Trading Systems LLC |
| Jacksonville, FL 32217 | |
| Phone # for sales: | 904-239-9564 |
| E-mail address: | lineartradingsys@gmail.com |
Traders' Resource Links | |
| Linear Trading Systems LLC has not added any product or service information to TRADERS' RESOURCE. | |
Click here for more information about our publications!
Comments
Date: 04/20/09Rank: 2Comment:

Request Information From Our Sponsors
- VectorVest, Inc.
- Executive Premier Workshop
- One-Day Options Course
- OptionsPro
- Retirement Income Workshop
- Sure-Fire Trading Systems (VectorVest, Inc.)
- Trading as a Business Workshop
- VectorVest 7 EOD
- VectorVest 7 RealTime/IntraDay
- VectorVest AutoTester
- VectorVest Educational Services
- VectorVest OnLine
- VectorVest Options Analyzer
- VectorVest ProGraphics v6.0
- VectorVest ProTrader 7
- VectorVest RealTime Derby Tool
- VectorVest Simulator
- VectorVest Variator
- VectorVest Watchdog
- StockCharts.com, Inc.
- Candle Patterns
- Candlestick Charting Explained
- Intermarket Technical Analysis
- John Murphy on Chart Analysis
- John Murphy's Chart Pattern Recognition
- John Murphy's Market Message
- MurphyExplainsMarketAnalysis-Intermarket Analysis
- MurphyExplainsMarketAnalysis-Visual Analysis
- StockCharts.com
- Technical Analysis of the Financial Markets
- The Visual Investor
