HOT TOPICS LIST
- MACD
- Fibonacci
- RSI
- Gann
- ADXR
- Stochastics
- Volume
- Triangles
- Futures
- Cycles
- Volatility
- ZIGZAG
- MESA
- Retracement
- Aroon
INDICATORS LIST
LIST OF TOPICS
PRINT THIS ARTICLE
by James Kupfer
Step back to look at the recent rally.
Position: Hold
James Kupfer
Mr. Kupfer is a market professional and amateur stock market commentator. Disclosure: It is likely that Mr. Kupfer has or will enter a position in any security he writes about.
PRINT THIS ARTICLE
TECHNICAL ANALYSIS
What Big Rally?
04/16/09 09:02:20 AMby James Kupfer
Step back to look at the recent rally.
Position: Hold
| If you have been following the financial news recently, you might have mistakenly thought that the Dow Jones and other major equity market indexes have put the bear market behind them. Step back from the rhetoric and hype, and you can get a better feel for how the market looks technically. |
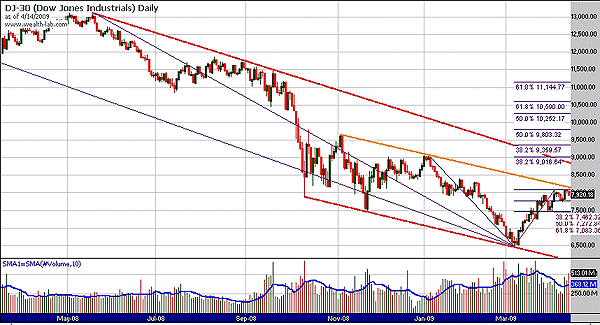
| Figure 1 is a daily chart of the Dow Jones Industrial Average (DJIA) showing the price action over roughly the last year. Looking at it from this limited perspective, we can see that the recent rally, although sharp and strong, really isn't all that important yet. Sure, the market is up 20% or more, but after dropping around 50% in the last year, is it really a surprise that the market has had a bounce? No, not at all. |

|
| FIGURE 1: DJIA, DAILY. A longer-term view at the recent rally shows the true progress — or lack thereof — for the markets. |
| Graphic provided by: Wealth-Lab. |
| |
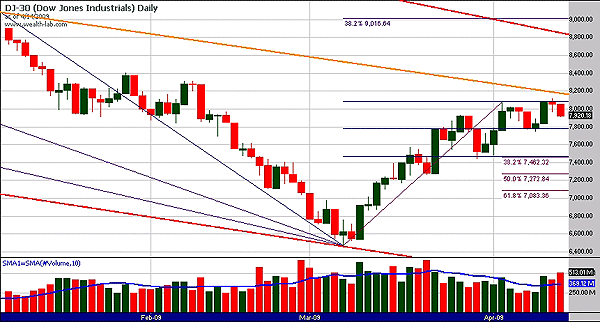
| In no way do I discount the possibility that this rally might turn into a significant intermediate-term bottom that might even continue for months, but there is still significant overhead resistance to overcome. Looking below on a zoomed-in version of the same chart, it is possible to see that prices have risen to the convergence of the 61.8% Fibonacci level from the January 2009 top to the recent bottom and the trendline formed (orange) from two other recent major tops. The ascent seems to be running out of steam, so there is no clear technical picture to show if this level will be exceeded. See Figure 2. |

|
| FIGURE 2: DJIA, DAILY. Here are near-term support and resistance levels for the DJIA. |
| Graphic provided by: Wealth-Lab. |
| |
| Should it fail, there is a strong level of Fibonacci support at 7450 where the aforementioned Fibonacci level at 38.2% resistance and the 38.2% retracement (purple) levels coincide. Should prices rise above 8200, there is further strong resistance at the red line. More resistance levels would likely become evident and come into play should the market continue. So while this may be the beginning of a sustained move, further proof of the market's intentions is needed. |
Mr. Kupfer is a market professional and amateur stock market commentator. Disclosure: It is likely that Mr. Kupfer has or will enter a position in any security he writes about.
Click here for more information about our publications!
Comments
Date: 04/17/09Rank: 5Comment:

Request Information From Our Sponsors
- VectorVest, Inc.
- Executive Premier Workshop
- One-Day Options Course
- OptionsPro
- Retirement Income Workshop
- Sure-Fire Trading Systems (VectorVest, Inc.)
- Trading as a Business Workshop
- VectorVest 7 EOD
- VectorVest 7 RealTime/IntraDay
- VectorVest AutoTester
- VectorVest Educational Services
- VectorVest OnLine
- VectorVest Options Analyzer
- VectorVest ProGraphics v6.0
- VectorVest ProTrader 7
- VectorVest RealTime Derby Tool
- VectorVest Simulator
- VectorVest Variator
- VectorVest Watchdog
- StockCharts.com, Inc.
- Candle Patterns
- Candlestick Charting Explained
- Intermarket Technical Analysis
- John Murphy on Chart Analysis
- John Murphy's Chart Pattern Recognition
- John Murphy's Market Message
- MurphyExplainsMarketAnalysis-Intermarket Analysis
- MurphyExplainsMarketAnalysis-Visual Analysis
- StockCharts.com
- Technical Analysis of the Financial Markets
- The Visual Investor
