HOT TOPICS LIST
- MACD
- Fibonacci
- RSI
- Gann
- ADXR
- Stochastics
- Volume
- Triangles
- Futures
- Cycles
- Volatility
- ZIGZAG
- MESA
- Retracement
- Aroon
INDICATORS LIST
LIST OF TOPICS
PRINT THIS ARTICLE
by Donald W. Pendergast, Jr.
The NASDAQ 100 index has been outperforming the Russell 2000 for more than six months now, and the technicals appear to support this trend continuing.
Position: N/A
Donald W. Pendergast, Jr.
Donald W. Pendergast is a financial markets consultant who offers specialized services to stock brokers and high net worth individuals who seek a better bottom line for their portfolios.
PRINT THIS ARTICLE
REL. STR COMPARATIVE
NASDAQ 100 Outperforming Russell 2000, Has Breakout Potential
04/15/09 02:00:08 PMby Donald W. Pendergast, Jr.
The NASDAQ 100 index has been outperforming the Russell 2000 for more than six months now, and the technicals appear to support this trend continuing.
Position: N/A
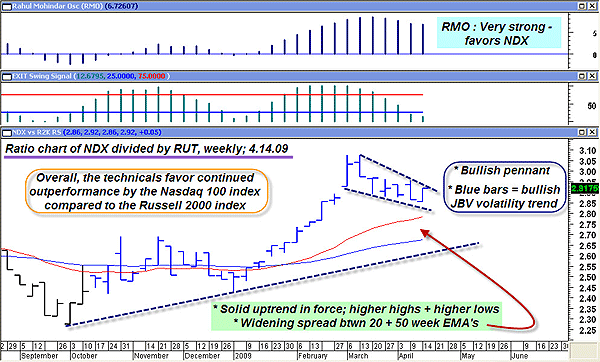
| There is a time for everything, and this everlasting truth certainly plays out in the stock market, where fortunes are made and lost due to the accuracy of market timing. From May 2000 to April 2007, small-cap stocks, those populating the Russell 2000 index (RUT), outperformed the larger-cap issues that dwell within the NASDAQ 100 (NDX) approximately 90% of the time. That doesn't mean that RUT was always in a bull run for that seven-year stretch; in fact, both indexes were in serious bear markets (2000-02) for a while, with RUT simply declining less severely than the tech-laden NDX. Lately, however, the tables have been turned, and NDX has taken the lead in this dual-index horse race. An examination of the NDX/RUT weekly ratio chart is our first stop in Figure 1. |

|
| FIGURE 1: NDX/RUT RATIO, WEEKLY. Five separate technical measures seem to agree that NDX will continue to outperform RUT, especially if the price has a bullish breakout of the pennant formation. |
| Graphic provided by: MetaStock. |
| |
| Early October 2008 marked the turning point where the balance of power between NDX and RUT began to shift. A couple of weeks after the reversal, the weekly bars had risen fast enough that the JBV volatility entry advisor in MetaStock had colored the price bars blue, affirming that the reversal was in fact legitimate. In the weeks following, a series of higher highs and higher lows were also completed, as was a bullish cross of the 50-week exponential moving average (EMA) by the slower 20-week EMA. Currently, the ratio chart is in pullback mode, and the chart is manifesting a very intriguing bullish pennant formation, one that typically resolves with a continuation of the bullish trend. Lending more weight to that possible outcome, the Rahul Mohindar oscillator (RMO) (at the top of the chart) is confirming the monster momentum of this NDX-dominated ratio chart, as is the widening spread between the 20-week and the 50-week EMAs. Now that we are reasonably sure that NDX may continue to outperform the RUT (if there is a bullish breakout from the pennant, followed by a continuation move, that is), we need to ascertain which stocks in NDX are demonstrating the best relative strength and momentum characteristics. Figure 2 gives us a clue. |

|
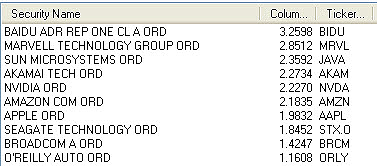
| FIGURE 2: 10 STRONGEST STOCKS IN THE NASDAQ 100 BASED ON RELATIVE STRENGTH. Strong stocks tend to remain strong for some time. |
| Graphic provided by: MetaStock. |
| |
| At present, Figure 2 depicts the 10 strongest NASDAQ 100 stocks based on a 13-week rate of change calculation versus NDX. The top three stocks -- BIDU, MRVL, and JAVA -- remain very strong, and even ORLY remains highly rated. Of course, as mentioned previously, timing is everything in life as well as in the stock market, so is there any NASDAQ 100 stock currently issuing a buy signal? Yes, there is, and we'll look at that stock's chart next. |

|
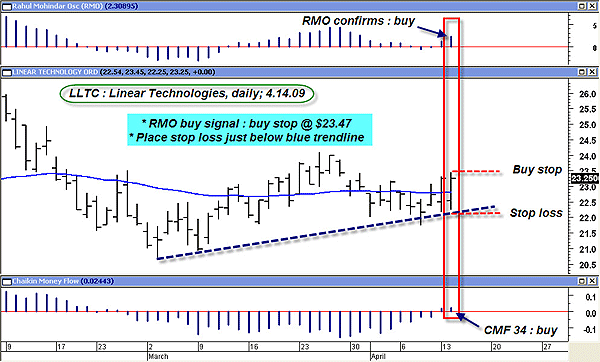
| FIGURE 3: LLTC, DAILY. A confirmed RMO swing buy signal appears to be confirmed by a variety of trend, money flow, momentum, and support confirmations. |
| Graphic provided by: MetaStock. |
| |
| Linear Technology's (LLTC) daily graph, shown in Figure 3, presents us with this very interesting RMO swing buy signal setup. While LLTC's relative strength ranking slightly lags NDX as a whole, this chart clearly shows us a stock with a long buy setup worthy of consideration. Everything lines up: the RMO has moved above the zero line, the money flow (CMF) (34) has followed suit, and the stock has rallied strongly off of trendline support, blasting above its 50-day EMA in the process. Savvy traders will want to be watching the action in NDX and QQQQ tomorrow should LLTC hit its $23.47 buy-stop entry price. If they rally in sympathy, then this trade is a definite go. If they fail to take out today's high as LLTC hits its buy-stop, traders should be a bit more cautious, perhaps putting on a smaller position instead. Look at the tick, TRIN (Arms index), and advance/decline ratio along with all the rest to determine just how aggressive you wish to get on this LLTC daily swing setup. |
| As far as trade management goes, after setting an initial stop-loss just below the blue uptrend line, a two- to three-bar trailing stop of the daily lows might work if the trade gains traction. Taking half off around $24.08 (the prior swing high) might also be a wise move should the trade arrive at that price zone, especially if NDX and QQQQ aren't manifesting especially bullish price patterns at that point in time. Bringing the stop up to breakeven, should the prior swing high be met, is also a sound strategy for this setup. |
Donald W. Pendergast is a financial markets consultant who offers specialized services to stock brokers and high net worth individuals who seek a better bottom line for their portfolios.
| Title: | Writer, market consultant |
| Company: | Linear Trading Systems LLC |
| Jacksonville, FL 32217 | |
| Phone # for sales: | 904-239-9564 |
| E-mail address: | lineartradingsys@gmail.com |
Traders' Resource Links | |
| Linear Trading Systems LLC has not added any product or service information to TRADERS' RESOURCE. | |
Click here for more information about our publications!
Comments
Date: 04/15/09Rank: 5Comment:

Request Information From Our Sponsors
- StockCharts.com, Inc.
- Candle Patterns
- Candlestick Charting Explained
- Intermarket Technical Analysis
- John Murphy on Chart Analysis
- John Murphy's Chart Pattern Recognition
- John Murphy's Market Message
- MurphyExplainsMarketAnalysis-Intermarket Analysis
- MurphyExplainsMarketAnalysis-Visual Analysis
- StockCharts.com
- Technical Analysis of the Financial Markets
- The Visual Investor
- VectorVest, Inc.
- Executive Premier Workshop
- One-Day Options Course
- OptionsPro
- Retirement Income Workshop
- Sure-Fire Trading Systems (VectorVest, Inc.)
- Trading as a Business Workshop
- VectorVest 7 EOD
- VectorVest 7 RealTime/IntraDay
- VectorVest AutoTester
- VectorVest Educational Services
- VectorVest OnLine
- VectorVest Options Analyzer
- VectorVest ProGraphics v6.0
- VectorVest ProTrader 7
- VectorVest RealTime Derby Tool
- VectorVest Simulator
- VectorVest Variator
- VectorVest Watchdog
