HOT TOPICS LIST
- MACD
- Fibonacci
- RSI
- Gann
- ADXR
- Stochastics
- Volume
- Triangles
- Futures
- Cycles
- Volatility
- ZIGZAG
- MESA
- Retracement
- Aroon
INDICATORS LIST
LIST OF TOPICS
PRINT THIS ARTICLE
by James Kupfer
Having turned the corner, gold is headed back down.
Position: N/A
James Kupfer
Mr. Kupfer is a market professional and amateur stock market commentator. Disclosure: It is likely that Mr. Kupfer has or will enter a position in any security he writes about.
PRINT THIS ARTICLE
STOCHASTICS
Gold Is The Big Picture
04/14/09 11:04:48 AMby James Kupfer
Having turned the corner, gold is headed back down.
Position: N/A
| On several occasions I have discussed my expectation that gold would drop below $700 an ounce over the next few months. As part of that forecast, I have stated that the February 2009 top in gold was likely to be the intermediate- to long-term top in price. Recent price action in gold has made it increasingly likely that the February top was in fact "the" top. Let's look at the evidence. |
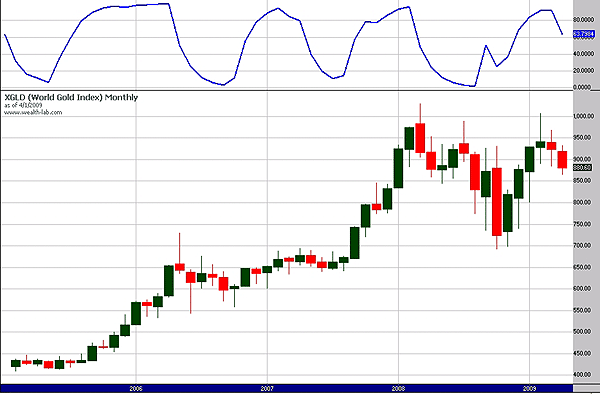
| On a monthly chart (Figure 1), you can see a few things of primary importance. First, in February 2009 the price of gold failed to exceed the previous top from March 2008. On a related note, it also failed in February to close above the March 2008 close. Looking at monthly stochastics, we can see that stochastics do a very good job identifying the tops and bottoms of the price action over the last few years. Their turndown represents further evidence of a new top. |

|
| FIGURE 1: XGLD, MONTHLY. The February 2008 was likely the high point in gold for the next few months. |
| Graphic provided by: Wealth-Lab. |
| |
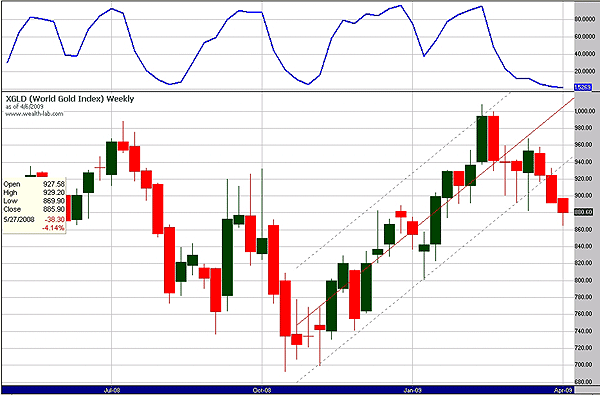
| Moving to a weekly view (Figure 2), we can see that gold has clearly broken below the linear regression channel that started in October 2008. Moreover, gold has broken below old price support range. This, of course, all points to weakness in gold and increases the likelihood that the February high will not be broken. |

|
| FIGURE 2: XGLD, WEEKLY. A broken linear regression channel signals more weakness ahead. |
| Graphic provided by: Wealth-Lab. |
| |
| For the short term, gold is oversold, so expect a swing back up. Assuming it does do so -- which is in no way a given -- gold would not be likely to break the $950-960 an ounce barrier. This could then provide another golden opportunity to establish shorts. |
Mr. Kupfer is a market professional and amateur stock market commentator. Disclosure: It is likely that Mr. Kupfer has or will enter a position in any security he writes about.
Click here for more information about our publications!
Comments
Date: 04/15/09Rank: 5Comment:
Date: 04/28/09Rank: 4Comment:

Request Information From Our Sponsors
- StockCharts.com, Inc.
- Candle Patterns
- Candlestick Charting Explained
- Intermarket Technical Analysis
- John Murphy on Chart Analysis
- John Murphy's Chart Pattern Recognition
- John Murphy's Market Message
- MurphyExplainsMarketAnalysis-Intermarket Analysis
- MurphyExplainsMarketAnalysis-Visual Analysis
- StockCharts.com
- Technical Analysis of the Financial Markets
- The Visual Investor
- VectorVest, Inc.
- Executive Premier Workshop
- One-Day Options Course
- OptionsPro
- Retirement Income Workshop
- Sure-Fire Trading Systems (VectorVest, Inc.)
- Trading as a Business Workshop
- VectorVest 7 EOD
- VectorVest 7 RealTime/IntraDay
- VectorVest AutoTester
- VectorVest Educational Services
- VectorVest OnLine
- VectorVest Options Analyzer
- VectorVest ProGraphics v6.0
- VectorVest ProTrader 7
- VectorVest RealTime Derby Tool
- VectorVest Simulator
- VectorVest Variator
- VectorVest Watchdog
