HOT TOPICS LIST
- MACD
- Fibonacci
- RSI
- Gann
- ADXR
- Stochastics
- Volume
- Triangles
- Futures
- Cycles
- Volatility
- ZIGZAG
- MESA
- Retracement
- Aroon
INDICATORS LIST
LIST OF TOPICS
PRINT THIS ARTICLE
by Koos van der Merwe
In fiscal year 2008, Harmony produced 1.55 million ounces of gold, making it one of the world's largest gold mining companies. How do the shares look?
Position: Buy
Koos van der Merwe
Has been a technical analyst since 1969, and has worked as a futures and options trader with First Financial Futures in Johannesburg, South Africa.
PRINT THIS ARTICLE
HEAD & SHOULDERS
A Trade For Harmony Gold Mines
04/13/09 11:50:56 AMby Koos van der Merwe
In fiscal year 2008, Harmony produced 1.55 million ounces of gold, making it one of the world's largest gold mining companies. How do the shares look?
Position: Buy
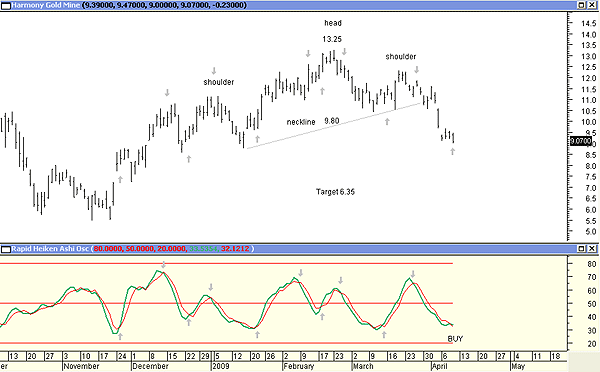
| In 2008, Harmony (HMY) produced 1.55 million ounces of gold, making it one of the world's largest gold mining companies. The group's operations are located primarily on the Witwatersrand Basin in South Africa, with a highly prospective exploration portfolio in Papua New Guinea. On April 7, London-based gold consultancy GMS Ltd. released its annual gold survey. The report stated that they believed that gold could quickly rebound above US$1,000 an ounce as investors looked for a safe haven amid ongoing economic turmoil, but unlike the popular view of gold bugs, GFMS did not see the boom lasting indefinitely. "How long [the rally] is sustained will be a function of what happens in the financial sphere - specifically, the US dollar, inflation, oil prices, and what happens in the equity markets. Some of that is very difficult to predict," GFMS research director Neil Meader said in an interview. The gold survey also showed that mine supply in 2008 took another dip, falling 62 tonnes to 2,416 tonnes. Mining companies appear to be having trouble boosting production as they deal with high costs, geopolitical risk, and a lack of new discoveries. The biggest weakness continues to be in South Africa, where production is falling at the fastest pace in more than 100 years. So why am I suggesting that we should look at Harmony Gold mines, a South African mine? Figure 1 shows why. |

|
| FIGURE 1: HMY, DAILY |
| Graphic provided by: MetaStock. |
| |
| The head & shoulders pattern can be clearly seen, with the neckline suggesting a target of $6.35 ( 13.25 - 9.80 = 3.45. 9.80 - 3.45 = 6.35). With the current price therefore at $9.05, why am I recommending the share as a buy? I am possibly way too early, but a look at the rapid heikin-ashi oscillator, which I have used as an indicator, suggests that a positive retracement is on the cards before a continuation of the downtrend. GMSF reiterated that a long-held view that the present rally in the gold price is driven entirely by investment demand, not backed by jewelry demand or anything else. The result is plenty of short-term volatility as investors jump in and out. So look at Harmony as a quick trade. Figure 1 shows that the indicator buy signals are always late, after the share price has already started moving up. Assuming that the pattern will repeat itself, we should buy now rather than later, but be ready to sell as soon as a sell signal is given. |
Has been a technical analyst since 1969, and has worked as a futures and options trader with First Financial Futures in Johannesburg, South Africa.
| Address: | 3256 West 24th Ave |
| Vancouver, BC | |
| Phone # for sales: | 6042634214 |
| E-mail address: | petroosp@gmail.com |
Click here for more information about our publications!
Comments
Date: 04/14/09Rank: 5Comment:

Request Information From Our Sponsors
- StockCharts.com, Inc.
- Candle Patterns
- Candlestick Charting Explained
- Intermarket Technical Analysis
- John Murphy on Chart Analysis
- John Murphy's Chart Pattern Recognition
- John Murphy's Market Message
- MurphyExplainsMarketAnalysis-Intermarket Analysis
- MurphyExplainsMarketAnalysis-Visual Analysis
- StockCharts.com
- Technical Analysis of the Financial Markets
- The Visual Investor
- VectorVest, Inc.
- Executive Premier Workshop
- One-Day Options Course
- OptionsPro
- Retirement Income Workshop
- Sure-Fire Trading Systems (VectorVest, Inc.)
- Trading as a Business Workshop
- VectorVest 7 EOD
- VectorVest 7 RealTime/IntraDay
- VectorVest AutoTester
- VectorVest Educational Services
- VectorVest OnLine
- VectorVest Options Analyzer
- VectorVest ProGraphics v6.0
- VectorVest ProTrader 7
- VectorVest RealTime Derby Tool
- VectorVest Simulator
- VectorVest Variator
- VectorVest Watchdog
