HOT TOPICS LIST
- MACD
- Fibonacci
- RSI
- Gann
- ADXR
- Stochastics
- Volume
- Triangles
- Futures
- Cycles
- Volatility
- ZIGZAG
- MESA
- Retracement
- Aroon
INDICATORS LIST
LIST OF TOPICS
PRINT THIS ARTICLE
by Chaitali Mohile
Cato Corp. has moved out of two strong bullish patterns and breached the long-term moving average resistance.
Position: N/A
Chaitali Mohile
Active trader in the Indian stock markets since 2003 and a full-time writer. Trading is largely based upon technical analysis.
PRINT THIS ARTICLE
TECHNICAL ANALYSIS
Is Cato Corp.'s Breakout Rally Under Siege?
04/09/09 09:50:39 AMby Chaitali Mohile
Cato Corp. has moved out of two strong bullish patterns and breached the long-term moving average resistance.
Position: N/A
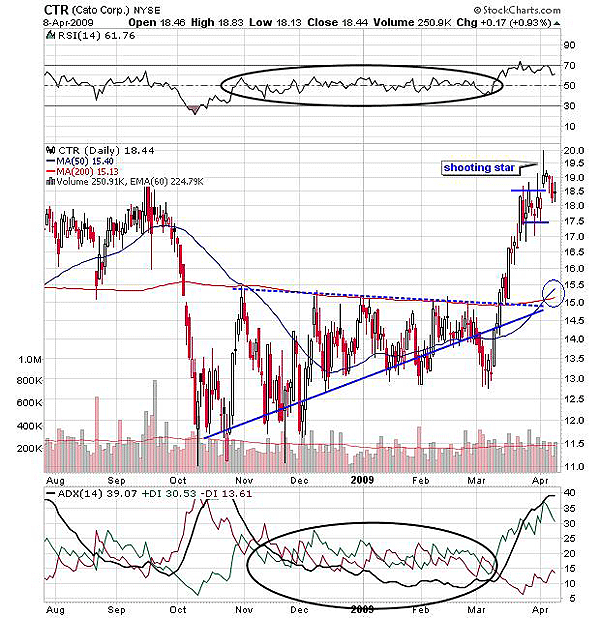
| The bullish breakout of an ascending triangle reversed the downtrend in Cato Corp (CTR). The average directional movement index (ADX) (14) in Figure 1 indicated a downtrend in 2008. The 200-day moving average (MA) resistance suppressed the pullback rallies from the higher lows of CTR. These price movements formed an ascending triangle in the downtrend, indicating trend reversal. In Figure 1, we can see that the 200-day MA is the resistance as well as a seller's line of the triangle. An upper horizontal trendline of an ascending triangle is called a seller's line, because traders enter short positions from these levels and reverse the trade near a lower rising trendline known as buyer's line. The bullish breakout of the triangle opened low-risk buying opportunities for the traders. After this breakout, CTR witnessed a robust bullish rally of $3.50. |

|
| FIGURE 1: CTR, DAILY. The ADX indicated a downtrend in 2008. |
| Graphic provided by: StockCharts.com. |
| |
| CTR began consolidating near the previous high resistance and the breakout target of $19 (length of triangle four-breakout level 15). The consolidation after an extensive advance rally formed a bullish flag & pennant pattern. In Figure 1, we can see that during the breakout of the flag & pennant, CTR formed a shooting star reversal candlestick pattern. As a result, the breakout rally failed to rise higher. The relative strength index (RSI) (14) is indicating the lack of bullish strength to move above an overbought level of 70. The ADX (14) has reached an overheated uptrend, and therefore, the rally is likely to slow down. |
| Very recently, the 50-day moving average (MA) has surged above the 200-day MA, indicating a bullish crossover. The crossover is the only developing bullish sign under the highly bullish conditions of the indicators in Figure 1. This suggests that the stock may establish support between $18 and $17.50. |

|
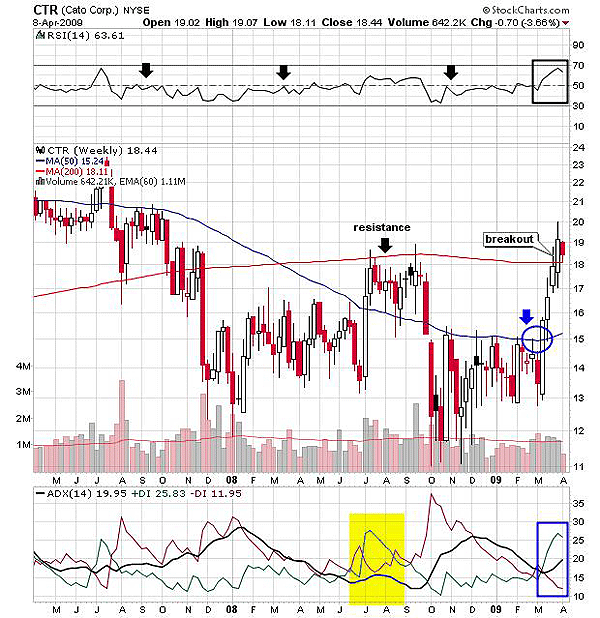
| FIGURE 2: CTR, WEEKLY. The 200-day MA has been the strongest long-term resistance. |
| Graphic provided by: StockCharts.com. |
| |
| The 200-day MA has been the strongest long-term resistance according to Figure 2. Earlier in July and August 2008, the ADX (14) (see the yellow marking) was very weak; CTR failed to violate the MA resistance. In addition, the RSI (14) ranged between the 30 and 50 levels. We can say that the 50-day MA breakout was the first successful bullish rally that breached the 200-day MA resistance. The breakout reversed the downtrend, and the RSI (14) showed strength by moving above the 50 levels. |
| The current bearish candle has freshly formed support of 200-day MA. The uptrend is developing, but the RSI (14) seems reluctant to cross the 70 level. To withhold the bullish sentiments and the uptrend, CTR should essentially sustain above the 200-day MA support. Due to the moderately bullish indicators, CTR is likely to consolidate with the MA support. Hence, the breakout rally loses its strength if CTR fails to establish support at the 200-day MA or between $18 and $17.50. |
Active trader in the Indian stock markets since 2003 and a full-time writer. Trading is largely based upon technical analysis.
| Company: | Independent |
| Address: | C1/3 Parth Indraprasth Towers. Vastrapur |
| Ahmedabad, Guj 380015 | |
| E-mail address: | chaitalimohile@yahoo.co.in |
Traders' Resource Links | |
| Independent has not added any product or service information to TRADERS' RESOURCE. | |
Click here for more information about our publications!
PRINT THIS ARTICLE

Request Information From Our Sponsors
- VectorVest, Inc.
- Executive Premier Workshop
- One-Day Options Course
- OptionsPro
- Retirement Income Workshop
- Sure-Fire Trading Systems (VectorVest, Inc.)
- Trading as a Business Workshop
- VectorVest 7 EOD
- VectorVest 7 RealTime/IntraDay
- VectorVest AutoTester
- VectorVest Educational Services
- VectorVest OnLine
- VectorVest Options Analyzer
- VectorVest ProGraphics v6.0
- VectorVest ProTrader 7
- VectorVest RealTime Derby Tool
- VectorVest Simulator
- VectorVest Variator
- VectorVest Watchdog
- StockCharts.com, Inc.
- Candle Patterns
- Candlestick Charting Explained
- Intermarket Technical Analysis
- John Murphy on Chart Analysis
- John Murphy's Chart Pattern Recognition
- John Murphy's Market Message
- MurphyExplainsMarketAnalysis-Intermarket Analysis
- MurphyExplainsMarketAnalysis-Visual Analysis
- StockCharts.com
- Technical Analysis of the Financial Markets
- The Visual Investor
