

HOT TOPICS LIST
- MACD
- Fibonacci
- RSI
- Gann
- ADXR
- Stochastics
- Volume
- Triangles
- Futures
- Cycles
- Volatility
- ZIGZAG
- MESA
- Retracement
- Aroon
INDICATORS LIST
LIST OF TOPICS
PRINT THIS ARTICLE
by Donald W. Pendergast, Jr.
Some bank savings accounts only pay 1% per year. Successful daytraders can make that much in just a few minutes -- sometimes. Here's one trade example that might provide some incentive to master the art of daytrading.
Position: N/A
Donald W. Pendergast, Jr.
Donald W. Pendergast is a financial markets consultant who offers specialized services to stock brokers and high net worth individuals who seek a better bottom line for their portfolios.
PRINT THIS ARTICLE
PIVOT POINT
USO Three-Minute Chart Pivot
04/09/09 09:47:34 AMby Donald W. Pendergast, Jr.
Some bank savings accounts only pay 1% per year. Successful daytraders can make that much in just a few minutes -- sometimes. Here's one trade example that might provide some incentive to master the art of daytrading.
Position: N/A
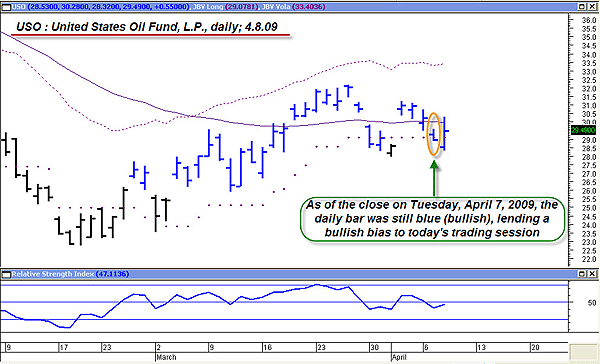
| The United States Oil Fund (USO) is one of the most amazing hybrid commodity/stock trading vehicles ever made available to the trading/investing public. This fund is actually set up as a limited partnership that trades various crude oil futures contracts, yet it can be bought and sold just as easily as shares of IBM or Intel. You don't need to have a margin account at a futures broker to trade it. It can be sold short, and you can buy as little as one share if that's all the excitement you can handle at the moment. All in all, it's an incredible way for equity traders to get in on the action in the crude oil market, without as much raw risk as trading the actual crude oil futures contracts. Even better, a full range of put and call options are also available for USO, allowing for a range of stock/option strategies to be pursued in this particular market. Let's zero in on today's intraday action in USO, dissecting a very quick and profitable trade setup that yielded 1.27% in only 17 minutes. I'll start off with a view of the daily graph of USO, one that provided a bullish bias for a successful long counter-trend intraday entry on a three-minute chart. See Figure 1. |
|
| FIGURE 1: USO, DAILY. Volatility analysis can be helpful in determining whether breakouts/trend reversals are valid. |
| Graphic provided by: MetaStock. |
| Graphic provided by: JBV expert advisor for MetaStock v 10.1. |
| |
| This is a custom-made daily JBV long volatility entry template for MetaStock; it's derived from a STOCKS & COMMODITIES article by renowned trader and author Jim Berg, which you can find in the February 2005 issue. Essentially, this chart will paint the daily bars blue when price volatility has exceeded a certain level over x number of days. Once volatility has propelled prices higher, the bars automatically change color to alert the trader of a likely change in trend bias. While you'll need to read the article for yourself to learn all the details, suffice it to say that volatility analysis is a wonderful technical tool, one that should help most traders stay on the right side of any emerging trends that they may encounter. So, the daily bars have been mostly blue (bullish) for the past five weeks in USO, the trend is up, and the money flows (not shown) are bullish. Depending on how the following session opened and then progressed, the bias for intraday setups was leaning toward the bullish side of the equation. |
|
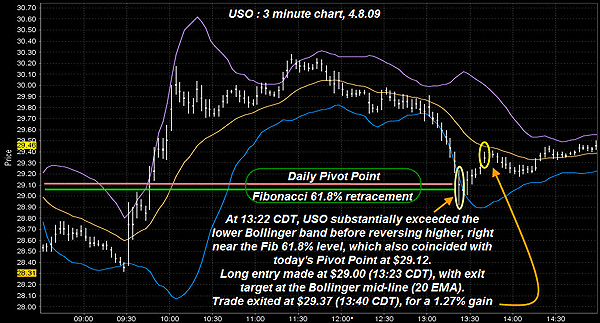
| FIGURE 2: USO, 3-MINUTE. Since the daily pivot point ($29.12) and the Fibonacci 62% retracement level ($29.07) were known well before prices began their mid-afternoon selloff, savvy intraday traders would have watched the sharp reversal at 13:23 CT with glee, realizing that a countertrend move higher was a distinct possibility. |
| Graphic provided by: Interactive Brokers 3-minute chart. |
| |
| Dropping down to the USO three-minute chart (Figure 2), it's easy to see that the intraday action featured plenty of roller-coaster moves. At about an hour into April 8's session, prices shot violently higher, riding the leading edge of the upper Bollinger band (set at two standard deviations, using a 20-period exponential moving average [EMA]) all the way up before beginning to settle down into a trading range that lasted until 13:00 CT. Then the "waterfall" selloff commenced, producing another Bollinger band-hugging episode down toward the combined support levels produced by the daily pivot point (PP) and the Fibonacci 61.8% retracement level. This support zone existed at the $29.07-29.12 area and was believed to offer a solid floor for a potential countertrend move higher. The fact that the price bar at 13:23 CT plunged down through the lower Bollinger band before sharply reversing back up to those previously mentioned support levels was a convincing display of the large amount of buying power that was prepared to reenter USO for another swing back higher. A long trade was entered at 13:23 CT at $29, perhaps a bit risky, since it was about a dime below the major support levels. Once entered, a mental stop-loss was held just below the three-minute reversal bar's low near $28.90, and the trade was allowed to run. The price target for this countertrend move (remember, price was below the downward-sloping 20-period EMA) was the Bollinger band centerline, the 20-period EMA, which was almost certain to offer resistance on a move back up. The trade was trailed with a two-bar trailing stop of the lows as well. The end result was a profitable and happy one, yielding 1.27% in 17 minutes. Not bad for a fairly low-stress countertrend trade in a bullish commodity stock. |
| While not everyone is well-suited for the stress of daytrading, the principles discussed here can apply to nearly any kind of trading. Discerning where prices are likely to reverse beforehand (by determining key support/resistance [S/R] levels) is one way to gain an edge on the markets you follow, and once you learn to read the market's price behavior as it interacts with those key S/R levels, you may be able to latch onto promising short-term countertrend moves that can help keep your finances miles ahead of most average investors. |
Donald W. Pendergast is a financial markets consultant who offers specialized services to stock brokers and high net worth individuals who seek a better bottom line for their portfolios.
| Title: | Writer, market consultant |
| Company: | Linear Trading Systems LLC |
| Jacksonville, FL 32217 | |
| Phone # for sales: | 904-239-9564 |
| E-mail address: | lineartradingsys@gmail.com |
Traders' Resource Links | |
| Linear Trading Systems LLC has not added any product or service information to TRADERS' RESOURCE. | |
Click here for more information about our publications!
Comments
Date:�04/14/09Rank:�4Comment:�

Request Information From Our Sponsors
- StockCharts.com, Inc.
- Candle Patterns
- Candlestick Charting Explained
- Intermarket Technical Analysis
- John Murphy on Chart Analysis
- John Murphy's Chart Pattern Recognition
- John Murphy's Market Message
- MurphyExplainsMarketAnalysis-Intermarket Analysis
- MurphyExplainsMarketAnalysis-Visual Analysis
- StockCharts.com
- Technical Analysis of the Financial Markets
- The Visual Investor
- VectorVest, Inc.
- Executive Premier Workshop
- One-Day Options Course
- OptionsPro
- Retirement Income Workshop
- Sure-Fire Trading Systems (VectorVest, Inc.)
- Trading as a Business Workshop
- VectorVest 7 EOD
- VectorVest 7 RealTime/IntraDay
- VectorVest AutoTester
- VectorVest Educational Services
- VectorVest OnLine
- VectorVest Options Analyzer
- VectorVest ProGraphics v6.0
- VectorVest ProTrader 7
- VectorVest RealTime Derby Tool
- VectorVest Simulator
- VectorVest Variator
- VectorVest Watchdog