HOT TOPICS LIST
- MACD
- Fibonacci
- RSI
- Gann
- ADXR
- Stochastics
- Volume
- Triangles
- Futures
- Cycles
- Volatility
- ZIGZAG
- MESA
- Retracement
- Aroon
INDICATORS LIST
LIST OF TOPICS
PRINT THIS ARTICLE
by Chaitali Mohile
The head & shoulders continuation pattern has extended strong neckline support for Smith & Nephew PLC. Will the stock form multiple shoulders or breach the neckline support?
Position: N/A
Chaitali Mohile
Active trader in the Indian stock markets since 2003 and a full-time writer. Trading is largely based upon technical analysis.
PRINT THIS ARTICLE
HEAD & SHOULDERS
SNN At Support
04/08/09 10:05:50 AMby Chaitali Mohile
The head & shoulders continuation pattern has extended strong neckline support for Smith & Nephew PLC. Will the stock form multiple shoulders or breach the neckline support?
Position: N/A
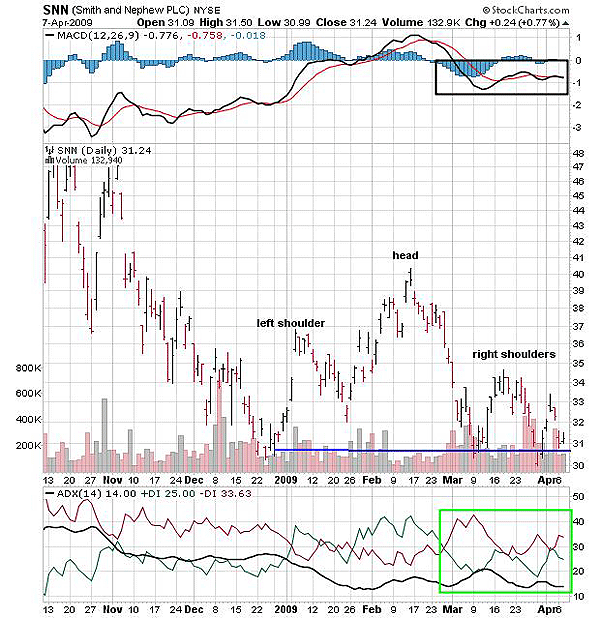
| On the daily chart in Figure 1, Smith & Nephew PLC (SNN) has formed a head & shoulders pattern after a huge decline. Here, the head & shoulders is a continuation of a current downside rally, and not a trend reversal indication because the pattern is not inverted like the head & shoulders bottom formation. In Figure 1, we can see the neckline support at $31, the left shoulder at $37, head at $40, and the right shoulder at $34. The downward breakout would drag SNN to the new lows. But according to the daily chart (Figure 1), SNN has formed another right shoulder (multiple) with the neckline support. |

|
| FIGURE 1: SNN, DAILY. The ADX (14) indicates consolidation with the neckline support. |
| Graphic provided by: StockCharts.com. |
| |
| The average directional movement index (ADX) (14) below 15 signifies a weak trend, while the converging movement of the negative directional index (-DI) and the positive directional index (+DI) are suggesting sideways price action. The moving average convergence/divergence (MACD) (12,26,9) is moving horizontally in positive territory, indicating a directionless rally. Therefore, the indicators suggest the possibility of consolidated price action. This means SNN would form multiple right shoulders till the short-term downtrend is developed. The pattern would fail if SNN rallied toward the head with the neckline support, so traders have to be alert. The breakout target for the head & shoulders continuous pattern in Figure 1 is $20 (40 - 31 = 11 - 31 neckline = 20). |

|
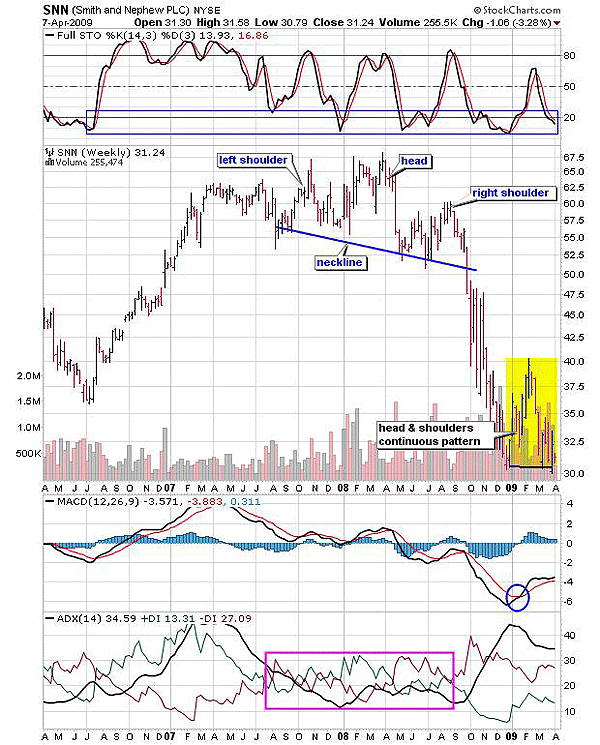
| FIGURE 2: SNN, WEEKLY. This chart shows the head & shoulders top in 2007–08 and the head & shoulders continuous formation at the lower levels. |
| Graphic provided by: StockCharts.com. |
| |
| According to the weekly chart in Figure 2, SNN formed a head & shoulder top in 2007–08. This pattern suggests that the uptrend is about to reverse with the neckline breakout. The declining neckline is an indication of the prevailing weakness. The ADX (14) shows how the downtrend was developed after the downside breakout. Earlier in 2007, the ADX (14) indicated a well-developed uptrend with a healthy buying pressure. When the uptrend turned overheated, the ADX (14) declined gradually. As the price broke downward below the neckline, SNN entered a fresh downtrend. The stock saw the breakout target of $37.5 (67.5 -55 = 12.5 - 50 = 37.5). |
| After the breakout of the trend reversal pattern, the stock took a nosedive to a new low at $30, much lower than the targeted level, by December 2008. Since then, SNN formed another head & shoulders pattern, but this time, a continuous formation. Thus, the head & shoulders continuous pattern has appeared on both time frames, making it stronger and most reliable. But in Figure 2, only a single right shoulder is visible. The ADX (14) is indicating a well-developed downtrend, and the moving average convergence/divergence (MACD) (12,26,9) shows a bullish crossover in negative territory. Considering the previous movement of the full stochastic (14,3,3), we can anticipate that the oscillator would surge immediately from an oversold area. But if the indicator fails to act accordingly, then SNN might break down from the neckline support. |
| Thus, the current scenario suggests that SNN is likely to establish the support on the neckline. In case the neckline support is breached, traders may want to trade with a target of $20. |
Active trader in the Indian stock markets since 2003 and a full-time writer. Trading is largely based upon technical analysis.
| Company: | Independent |
| Address: | C1/3 Parth Indraprasth Towers. Vastrapur |
| Ahmedabad, Guj 380015 | |
| E-mail address: | chaitalimohile@yahoo.co.in |
Traders' Resource Links | |
| Independent has not added any product or service information to TRADERS' RESOURCE. | |
Click here for more information about our publications!
PRINT THIS ARTICLE

|

Request Information From Our Sponsors
- StockCharts.com, Inc.
- Candle Patterns
- Candlestick Charting Explained
- Intermarket Technical Analysis
- John Murphy on Chart Analysis
- John Murphy's Chart Pattern Recognition
- John Murphy's Market Message
- MurphyExplainsMarketAnalysis-Intermarket Analysis
- MurphyExplainsMarketAnalysis-Visual Analysis
- StockCharts.com
- Technical Analysis of the Financial Markets
- The Visual Investor
- VectorVest, Inc.
- Executive Premier Workshop
- One-Day Options Course
- OptionsPro
- Retirement Income Workshop
- Sure-Fire Trading Systems (VectorVest, Inc.)
- Trading as a Business Workshop
- VectorVest 7 EOD
- VectorVest 7 RealTime/IntraDay
- VectorVest AutoTester
- VectorVest Educational Services
- VectorVest OnLine
- VectorVest Options Analyzer
- VectorVest ProGraphics v6.0
- VectorVest ProTrader 7
- VectorVest RealTime Derby Tool
- VectorVest Simulator
- VectorVest Variator
- VectorVest Watchdog
