HOT TOPICS LIST
- MACD
- Fibonacci
- RSI
- Gann
- ADXR
- Stochastics
- Volume
- Triangles
- Futures
- Cycles
- Volatility
- ZIGZAG
- MESA
- Retracement
- Aroon
INDICATORS LIST
LIST OF TOPICS
PRINT THIS ARTICLE
by Donald W. Pendergast, Jr.
Weak stocks in weak industry groups can offer good short-sale opportunities, but you need a well-grounded plan of action in order to identify opportunities and implement a sound trading strategy.
Position: Sell
Donald W. Pendergast, Jr.
Donald W. Pendergast is a financial markets consultant who offers specialized services to stock brokers and high net worth individuals who seek a better bottom line for their portfolios.
PRINT THIS ARTICLE
SHORT SELLING
A New Short Signal For LLY
04/09/09 08:13:23 AMby Donald W. Pendergast, Jr.
Weak stocks in weak industry groups can offer good short-sale opportunities, but you need a well-grounded plan of action in order to identify opportunities and implement a sound trading strategy.
Position: Sell
| Shares of Eli Lilly and Co. (LLY) are trading for about 40% of what they were going for in early 2004, and the recent price action in this health-care giant's stock does little to instill a sense of optimism among longer-term investors. Let's look at the essentials of a brand-new LLY short setup, evaluating the odds for success of this trade setup. Running the Standard & Poor's 500 industry groups for a check of their respective relative strength rankings revealed that the pharmaceuticals, biotechnology, and life sciences industry group (.GSPPHB) is underperforming the S&P 500 (based on a 13-week rate of change calculation). Digging a little deeper, we also see that shares of LLY are among the worst-performing of the 24 stocks making up this particular industry group. Even better for short-sellers, the Rahul Mohindar system's (RMO) swing trade MetaStock exploration has also fired a sell signal on LLY. With such a potential powerful synergy of negative trade dynamics working against LLY, it might be worth taking a look at the stock's technical action, beginning with the weekly chart. |

|
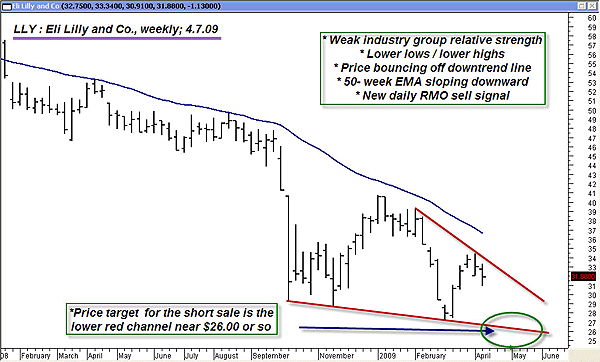
| FIGURE 1: LLY, WEEKLY. Here's an image of a weak stock in an underperforming industry group. The odds would appear to be favorable for a short sale in this stock, given the proper set of daily chart dynamics. |
| Graphic provided by: MetaStock. |
| |
| Figure 1 shows a weak stock, one still in an official downtrend per classic technical chart reading rules -- a series of lower highs and lower lows, a downward sloping major moving average (the 50-week exponential moving average [EMA]) and bearish trendlines all confirm the sad state of affairs for this pharmaceutical giant, a firm that also boasts a pathetic earnings per share (EPS) of (1.68) per share. Without even glancing at the daily chart, it's pretty easy to see that the $26 area might be a logical target for a short sale, especially if the broad markets remain weak for the next few weeks. |

|
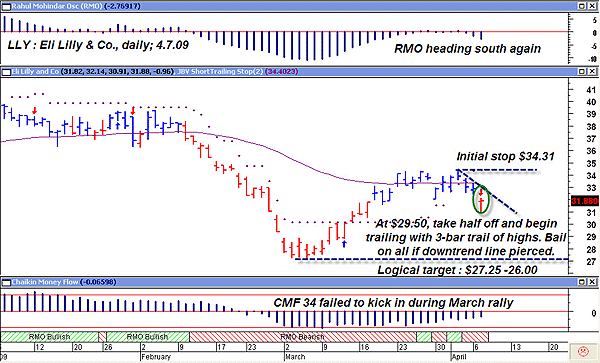
| FIGURE 2: LLY, DAILY. Weak money flow and momentum patterns, combined with a new short-sale signal, may offer an opportunity for nimble traders to grab some "borrow now, cover later" cash in this large-cap health-care industry stock. |
| Graphic provided by: MetaStock. |
| Graphic provided by: Rahul Mohindar indicators from Metastock v 10.1. |
| |
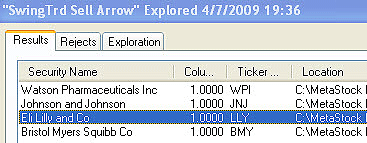
| LLY's daily chart (Figure 2) provides even more specific trade guidance; here we see that the RMO (at the top of the chart), one of the more meaningful momentum-based technical tools available, has just begun to dip beneath its zero line. In addition, the Chaikin money flow (CMF) (34) is still buried beneath its own zero line, having barely made any real progress at all during the recent March rally. Finally, the RMO sell signal itself, one confirmed by all of the aforementioned technical errata, is usually a reliable guide as to the direction of prices. While it's labeled as a swing signal, in many cases, the signal fires a substantial distance from the recent swing high or low, thus behaving more like a channel breakout or volatility entry signal. Because of this reality, traders using this RMO swing signal method need to make sure they stay on the right side of the broad market and industry group trend when using this method, limiting risk with stop-loss orders. They should also take logical, partial profits when they materialize and let the remainder of the position run for as long as the trend (swing) persists. See Figure 3. |

|
| FIGURE 3: RMO SIGNALS. A number of stocks from the S&P pharmaceuticals, biotechnology, and life sciences industry group (.GSPPHB) fired short RMO swing trade signals today. |
| Graphic provided by: MetaStock. |
| |
| How to trade this setup? Swing traders might place a sell-stop entry order just below today's low ($30.91); if filled, place a buy to cover order near the recent swing high at $34.31. Since the logical price target (previously discussed) lies near $26, this trade setup offers a risk-reward ratio of nearly 1.5 to 1. While that's nothing to write home about, there's nothing that says that enterprising traders couldn't wait for an intraday pullback once $30.91 is broken, hoping for a slightly better entry price. In fact, why not place half the order at $30.91 and then wait for that pullback/reversal on a 30-minute chart to short the rest of the order? A sound understanding of intraday trade dynamics (pivot points, EMA spreads, and so on) would be very useful for traders attempting to milk the most they can in this way from this short setup. Entry considerations aside, this short setup's stop-loss should be lowered as soon as possible, if $29.50 can be reached in short order. At that point, take half the position off (to minimize the potential damage of a short-squeeze) and begin trailing the whole deal with a three-bar trail of the highs. In addition, should either the $27 area be reached or the downtrend line be violated, consider bailing out on the remainder of the position, as the trade dynamics at that point would offer little incentive for profit-hungry shortsters to hang around any longer. |
Donald W. Pendergast is a financial markets consultant who offers specialized services to stock brokers and high net worth individuals who seek a better bottom line for their portfolios.
| Title: | Writer, market consultant |
| Company: | Linear Trading Systems LLC |
| Jacksonville, FL 32217 | |
| Phone # for sales: | 904-239-9564 |
| E-mail address: | lineartradingsys@gmail.com |
Traders' Resource Links | |
| Linear Trading Systems LLC has not added any product or service information to TRADERS' RESOURCE. | |
Click here for more information about our publications!
Comments
Date: 04/14/09Rank: 1Comment:

Request Information From Our Sponsors
- VectorVest, Inc.
- Executive Premier Workshop
- One-Day Options Course
- OptionsPro
- Retirement Income Workshop
- Sure-Fire Trading Systems (VectorVest, Inc.)
- Trading as a Business Workshop
- VectorVest 7 EOD
- VectorVest 7 RealTime/IntraDay
- VectorVest AutoTester
- VectorVest Educational Services
- VectorVest OnLine
- VectorVest Options Analyzer
- VectorVest ProGraphics v6.0
- VectorVest ProTrader 7
- VectorVest RealTime Derby Tool
- VectorVest Simulator
- VectorVest Variator
- VectorVest Watchdog
- StockCharts.com, Inc.
- Candle Patterns
- Candlestick Charting Explained
- Intermarket Technical Analysis
- John Murphy on Chart Analysis
- John Murphy's Chart Pattern Recognition
- John Murphy's Market Message
- MurphyExplainsMarketAnalysis-Intermarket Analysis
- MurphyExplainsMarketAnalysis-Visual Analysis
- StockCharts.com
- Technical Analysis of the Financial Markets
- The Visual Investor
