HOT TOPICS LIST
- MACD
- Fibonacci
- RSI
- Gann
- ADXR
- Stochastics
- Volume
- Triangles
- Futures
- Cycles
- Volatility
- ZIGZAG
- MESA
- Retracement
- Aroon
INDICATORS LIST
LIST OF TOPICS
PRINT THIS ARTICLE
by Chaitali Mohile
After violating a few strong resistance levels, Loral Space & Communications has formed a bullish flag & pennant pattern. What can be the potential target for the breakout rally?
Position: Buy
Chaitali Mohile
Active trader in the Indian stock markets since 2003 and a full-time writer. Trading is largely based upon technical analysis.
PRINT THIS ARTICLE
BREAKOUTS
LORL Undergoes Bullish Breakout
04/07/09 11:09:30 AMby Chaitali Mohile
After violating a few strong resistance levels, Loral Space & Communications has formed a bullish flag & pennant pattern. What can be the potential target for the breakout rally?
Position: Buy
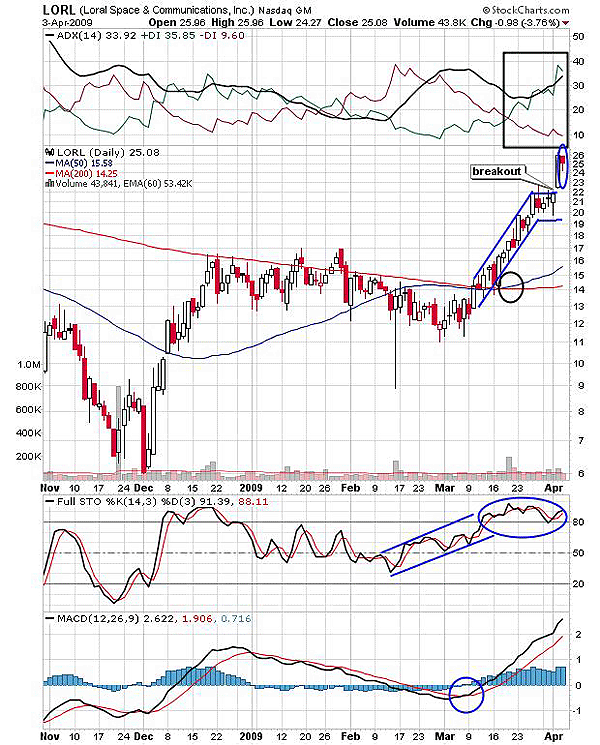
| Loral Space & Communications (LORL) was rallying during December 2008 till it hit its 200-day moving average (MA). The pullback rally that started towards the end of December 2008 consolidated approximately for three months under the 200-day MA resistance. The sideways price action indicated developing bullish momentum; otherwise, LORL would have plunged under the robust resistance. The full stochastic (14,3,3) supported the rally by sustaining above the 50 level, indicating positive momentum and the possibility of fresh long positions. The upward channel of the oscillator shows a positive divergence toward the price rally. The advancing positive directional index (+DI) of the average directional movement index (ADX) (14) suggested increasing buying pressure. |
| On these bullish notes, LORL breached the 200-day MA resistance and initiated a strong upward rally. The bullish moving average crossover (see the marked circle in Figure 1) on the price chart signified the stability of the new breakout rally. Therefore, LORL witnessed an exclusive bullish rally of $8 on moderate volume. Later, the stock consolidated in the range of $20 and $22, forming a bullish flag & pennant pattern. The ADX (14) is indicating a well-developed uptrend, and the overbought stochastic suggested that LORL would resume the prior rally after a bullish breakout. In Figure 1, we can see that the bullish flag & pennant has already broken out and has hit a 52-week high. The technical indicators including the moving average convergence/divergence (MACD) (12,26,9) are bullish, so we can anticipate that the rally can meet its target. |

|
| FIGURE 1: LORL, DAILY. The hanging man candlestick pattern is indicating a small correction. The strong indicators would help LORL initiate a fresh upside rally with the support of $22. |
| Graphic provided by: StockCharts.com. |
| |
| The potential target on the bullish flag & pennant breakout is measured by adding the breakout level to the length of a flagpole. Therefore, (22 - 14 = 8 + 22 = 30) $30 is the minimum estimated level for LORL. The strong momentum indicators and the current bullish wave in financial markets would carry LORL toward the targeted level. Considering a hanging man candlestick pattern on the daily chart in Figure 1, I would not recommend long positions at current levels as the stock could retrace toward the newly formed support at $22 (breakout level). After completing this reaction move, LORL is likely to begin its bullish rally with the retested support of $22 offering fresh trading opportunities. |

|
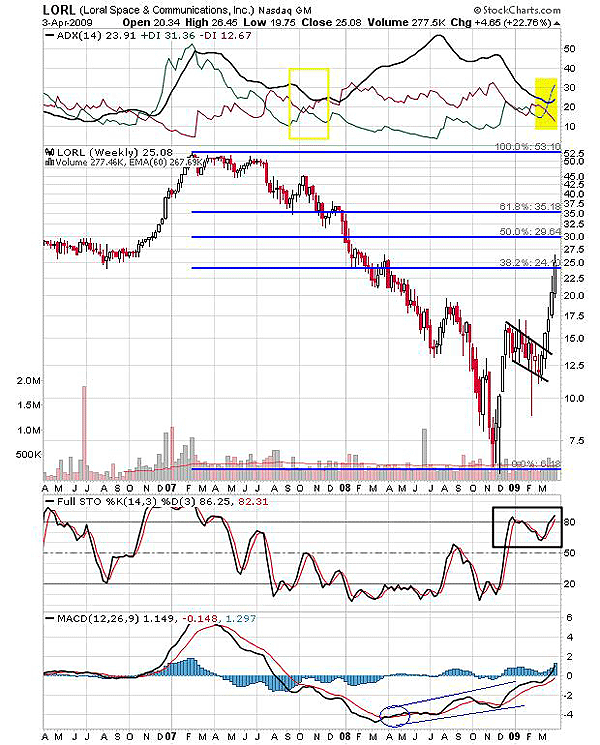
| FIGURE 2: LORL, WEEKLY. LORL rallied higher after the bullish breakout of the flag & pennant pattern. The 50% Fibonacci retracement level is the potential target for the future rally. |
| Graphic provided by: StockCharts.com. |
| |
| Figure 2 with three years' data shows a huge downfall of LORL since 2007. An uptrend reversed as the price declined more than 50% of the Fibonacci retracement level. The marked rectangle in ADX (14) highlights the trend change. By December 2008, the LORL stock value was worth $7.50. An overheated downtrend, an oversold stochastic (14,3,3), and the positive divergence of MACD (12,26,9) encouraged the pullback rally from $7.50. In a time frame of three weeks, LORL reached $15 levels and later consolidated, forming the flag & pennant -- a bullish continuation pattern. The stock went through a robust breakout at $13 approximately and soon hit the potential target of $20.50 (15 - 7.5 = 7.5 + 13). LORL surged even above the targeted level, indicating the strength in the breakout rally. |
| The Fibonacci retracement tool shows that the stock recovered to the 38.2% level. After an extended bullish rally, the stock is likely to halt under the resistance of the lowest Fibonacci retracement level. The next resistance at 50% level ($29.64) reconfirms the target calculated according to the daily frame ($30). Hence, traders may enter long at $22 with the target of $30. |
Active trader in the Indian stock markets since 2003 and a full-time writer. Trading is largely based upon technical analysis.
| Company: | Independent |
| Address: | C1/3 Parth Indraprasth Towers. Vastrapur |
| Ahmedabad, Guj 380015 | |
| E-mail address: | chaitalimohile@yahoo.co.in |
Traders' Resource Links | |
| Independent has not added any product or service information to TRADERS' RESOURCE. | |
Click here for more information about our publications!
Comments
Date: 04/07/09Rank: 2Comment:

Request Information From Our Sponsors
- StockCharts.com, Inc.
- Candle Patterns
- Candlestick Charting Explained
- Intermarket Technical Analysis
- John Murphy on Chart Analysis
- John Murphy's Chart Pattern Recognition
- John Murphy's Market Message
- MurphyExplainsMarketAnalysis-Intermarket Analysis
- MurphyExplainsMarketAnalysis-Visual Analysis
- StockCharts.com
- Technical Analysis of the Financial Markets
- The Visual Investor
- VectorVest, Inc.
- Executive Premier Workshop
- One-Day Options Course
- OptionsPro
- Retirement Income Workshop
- Sure-Fire Trading Systems (VectorVest, Inc.)
- Trading as a Business Workshop
- VectorVest 7 EOD
- VectorVest 7 RealTime/IntraDay
- VectorVest AutoTester
- VectorVest Educational Services
- VectorVest OnLine
- VectorVest Options Analyzer
- VectorVest ProGraphics v6.0
- VectorVest ProTrader 7
- VectorVest RealTime Derby Tool
- VectorVest Simulator
- VectorVest Variator
- VectorVest Watchdog
