HOT TOPICS LIST
- MACD
- Fibonacci
- RSI
- Gann
- ADXR
- Stochastics
- Volume
- Triangles
- Futures
- Cycles
- Volatility
- ZIGZAG
- MESA
- Retracement
- Aroon
INDICATORS LIST
LIST OF TOPICS
PRINT THIS ARTICLE
by Donald W. Pendergast, Jr.
Trendlines, pivot points, rectangles, fakeouts, and EMAs. The daytrading jungle might seem a bit less intimidating once you grasp a few important intraday trading concepts.
Position: N/A
Donald W. Pendergast, Jr.
Donald W. Pendergast is a financial markets consultant who offers specialized services to stock brokers and high net worth individuals who seek a better bottom line for their portfolios.
PRINT THIS ARTICLE
DAY TRADING
A Daytrading Primer For CTSH
04/07/09 08:56:59 AMby Donald W. Pendergast, Jr.
Trendlines, pivot points, rectangles, fakeouts, and EMAs. The daytrading jungle might seem a bit less intimidating once you grasp a few important intraday trading concepts.
Position: N/A
| Cognizant Technology Solutions, Inc. (CTSH), common shares did pretty well during the March 2009 rebound, rising from the low $17 area up to almost $23. Not only was the stock a good swing trading performer (offering two excellent long swing entry opportunities), but the stock's trend and relative strength characteristics also made it an attractive daytrading candidate for the session for Monday, April 6, 2009. Beginning with CTSH's daily chart, we'll examine some of the essential ingredients that are necessary to achieve a proper understanding of intraday trading dynamics. |

|
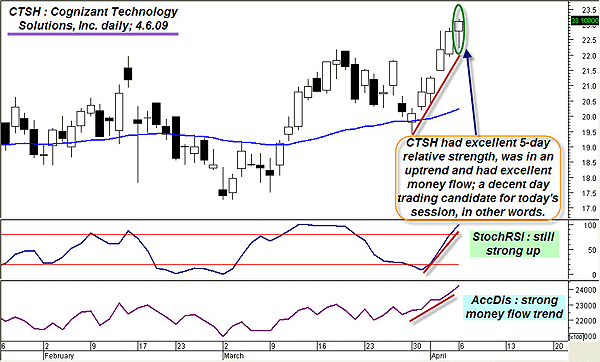
| FIGURE 1: CTSH, DAILY. Confirming the relative strength, swing characteristics, money flow trend, and momentum on daily charts can help lay the groundwork for successful intraday trades on the stocks you follow. |
| Graphic provided by: MetaStock. |
| |
| The daily graph of CTSH (Figure 1) shows a stock in a nice uptrend; the recent wavelike swings were a short-term trader's dream. In fact, if you look at CTSH's past trading action, you'll probably also agree that this is one of the better swing trading candidates in the entire NASDAQ 100 index. Regardless, as of Friday's close, it appeared that the odds were good that CTSH could continue higher for another day or two, based on the typical swing lengths seen in the recent past. Money flows, as evidenced by the accumulation/distribution indicator, were exceptionally bullish, the 50-day exponential moving average (EMA) was curling higher, and the stochRSI had yet to peak and roll over. Based on those assumptions for continued bullish price action, CTSH would have been a good intraday trading candidate for April 6's session. |

|
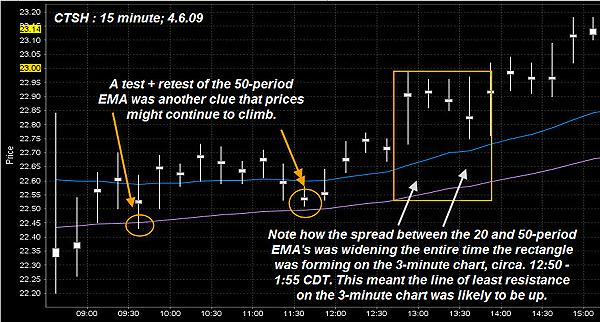
| FIGURE 2: CTSH, 15-MINUTE. Using a 15-minute intraday chart to determine a trend bias can help make entries on three- and five-minute charts less stressful. Support/resistance tests, retests, and widening/narrowing EMA spreads can offer powerful clues as to the likely path of future prices. |
| Graphic provided by: Interactive Brokers 15-minute chart. |
| |
| CTSH's 15-minute chart (Figure 2) shows that the stock covered a lot of ground on the first bar in this time frame ($22.84–22.21) before beginning to trend higher. As price tested and then successfully retested the upward-sloping 50-period EMA, the stock was telegraphing its probable direction — higher. Remember, the daily chart's trend bias was a strong up, so this lower time frame's confirmation added even more fuel to the bullish bias in this stock. |

|
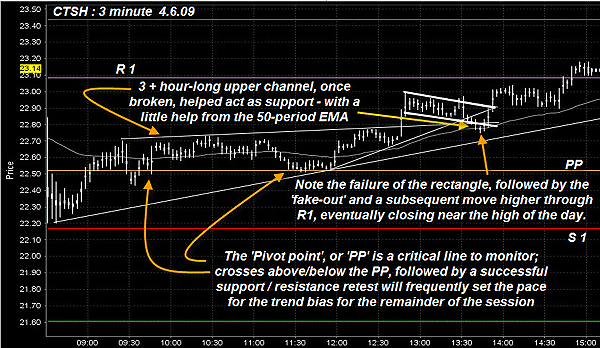
| FIGURE 3: CTSH, THREE-MINUTE. Learning to read intraday charts takes some time and patience, but when combined with a solid knowledge of higher time frame price action, it can be a very profitable activity. |
| Graphic provided by: Interactive Brokers 3-minute chart. |
| |
| Finally, with the three-minute chart (Figure 3), there is a lot there, so take some time to visually isolate each trendline and pivot to get a better overall comprehension of the intraday dynamics at work at CTSH. The line in the sand for every intraday chart is the pivot point (PP). On this chart, it's the orange horizontal line. Note how the volatility at the open caused prices to straddle both sides of the PP, finally settling in just a little above the first intraday support level at S1 (red horizontal line). Prices gradually rose, breaching the PP to the upside, after which the PP acted as strong support on two occasions between 9:30–12:00 CDT. Bear in mind, the previously discussed action that was occurring simultaneously on the 15-minute chart; the trend was rising and the upward sloping 50-period EMA was successfully tested. The daily chart's trend bias was also bullish. The successful test and retest of the PP on this three-minute chart took on a much greater significance in the light of those particular higher time frame chart dynamics. There's more; the successful retest of the PP also formed the second point in a major uptrend line (silver line), which was also followed by a bullish break of the 50-period EMA. That was a prime intraday entry point (about 11:57 CDT at $22.61). The next prime entry point was at $22.79 at 12:47 CDT, when CTSH blasted above a three-hour-long upper channel line (silver line). Both entries offered exceptional low-risk scalp trading opportunities for savvy traders. From 12:50 to 1:50 CDT the stock traced out a well-defined rectangle, one that featured a false breakout and then a fakeout move lower. That false move lower was turned back by a combination of the 50-period EMA and the aforementioned three-hour long upper channel line that subsequently became a support level. A little later, the break higher from the rectangle finally proved out, and the rest of the session saw CTSH grind ever higher following another round of sideways action. The breakout was fairly low risk, given the higher time frame trend biases and the fact that the day's prior high was also taken out on the break. |
| While it takes some time to become adept at intraday chart reading, the main concept is this — always check the trend biases of at least one and preferably two higher time frames before attempting to time your intraday entries. The more technicals that multiple time frames have in agreement, the easier it will be to time short-term trades on intraday charts. |
Donald W. Pendergast is a financial markets consultant who offers specialized services to stock brokers and high net worth individuals who seek a better bottom line for their portfolios.
| Title: | Writer, market consultant |
| Company: | Linear Trading Systems LLC |
| Jacksonville, FL 32217 | |
| Phone # for sales: | 904-239-9564 |
| E-mail address: | lineartradingsys@gmail.com |
Traders' Resource Links | |
| Linear Trading Systems LLC has not added any product or service information to TRADERS' RESOURCE. | |
Click here for more information about our publications!
Comments
Date: 04/07/09Rank: 4Comment:
Date: 11/16/19Rank: 5Comment:

Request Information From Our Sponsors
- StockCharts.com, Inc.
- Candle Patterns
- Candlestick Charting Explained
- Intermarket Technical Analysis
- John Murphy on Chart Analysis
- John Murphy's Chart Pattern Recognition
- John Murphy's Market Message
- MurphyExplainsMarketAnalysis-Intermarket Analysis
- MurphyExplainsMarketAnalysis-Visual Analysis
- StockCharts.com
- Technical Analysis of the Financial Markets
- The Visual Investor
- VectorVest, Inc.
- Executive Premier Workshop
- One-Day Options Course
- OptionsPro
- Retirement Income Workshop
- Sure-Fire Trading Systems (VectorVest, Inc.)
- Trading as a Business Workshop
- VectorVest 7 EOD
- VectorVest 7 RealTime/IntraDay
- VectorVest AutoTester
- VectorVest Educational Services
- VectorVest OnLine
- VectorVest Options Analyzer
- VectorVest ProGraphics v6.0
- VectorVest ProTrader 7
- VectorVest RealTime Derby Tool
- VectorVest Simulator
- VectorVest Variator
- VectorVest Watchdog
