HOT TOPICS LIST
- MACD
- Fibonacci
- RSI
- Gann
- ADXR
- Stochastics
- Volume
- Triangles
- Futures
- Cycles
- Volatility
- ZIGZAG
- MESA
- Retracement
- Aroon
INDICATORS LIST
LIST OF TOPICS
PRINT THIS ARTICLE
by Koos van der Merwe
With the world in recession, common belief is that investors should flock to gold to protect their wealth. Research suggests otherwise.
Position: Sell
Koos van der Merwe
Has been a technical analyst since 1969, and has worked as a futures and options trader with First Financial Futures in Johannesburg, South Africa.
PRINT THIS ARTICLE
TREND-CHANNEL
My Problem With Gold
04/06/09 09:22:18 AMby Koos van der Merwe
With the world in recession, common belief is that investors should flock to gold to protect their wealth. Research suggests otherwise.
Position: Sell
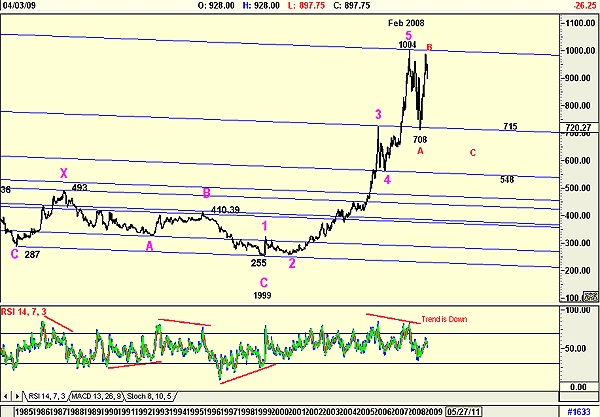
| With gold exchange traded funds (ETFs) available, buying physical gold and hiding it under your mattress is a thing of the past. Is this correct thing to do? Is gold on the way up? Figure 1 suggests otherwise. |

|
| FIGURE 1: GOLD, WEEKLY. This chart of weekly gold shows trend channels. |
| Graphic provided by: AdvancedGET. |
| |
| Figure 1 is a weekly chart of the gold price and shows how gold rose from a low of $255 per ounce in 1999 to a high of $1,004 per oz. by February 2008. My Elliott wave count suggests that the count was a five-impulse wave up, and retracement from that date is an AB correction with wave C still to come. Drawing trendlines from the low as shown, we can see how the low of wave B was on the trendline drawn parallel from the top of wave 3. The relative strength index (RSI) has given a divergence sell signal, and the chart suggests that the low of wave C should be somewhere between 548 and 715, the range of the fourth wave of lesser degree. With a predicted drop in the gold price, does this mean that money will move from gold back into the stock market? Probably. Gold does not pay a dividend. It is purely a capital gain play? As the market starts recovering, money will move back into those stocks that have been heavily oversold, especially. |
Has been a technical analyst since 1969, and has worked as a futures and options trader with First Financial Futures in Johannesburg, South Africa.
| Address: | 3256 West 24th Ave |
| Vancouver, BC | |
| Phone # for sales: | 6042634214 |
| E-mail address: | petroosp@gmail.com |
Click here for more information about our publications!
Comments
Date: 04/07/09Rank: 5Comment:
Date: 04/07/09Rank: 4Comment:

Request Information From Our Sponsors
- VectorVest, Inc.
- Executive Premier Workshop
- One-Day Options Course
- OptionsPro
- Retirement Income Workshop
- Sure-Fire Trading Systems (VectorVest, Inc.)
- Trading as a Business Workshop
- VectorVest 7 EOD
- VectorVest 7 RealTime/IntraDay
- VectorVest AutoTester
- VectorVest Educational Services
- VectorVest OnLine
- VectorVest Options Analyzer
- VectorVest ProGraphics v6.0
- VectorVest ProTrader 7
- VectorVest RealTime Derby Tool
- VectorVest Simulator
- VectorVest Variator
- VectorVest Watchdog
- StockCharts.com, Inc.
- Candle Patterns
- Candlestick Charting Explained
- Intermarket Technical Analysis
- John Murphy on Chart Analysis
- John Murphy's Chart Pattern Recognition
- John Murphy's Market Message
- MurphyExplainsMarketAnalysis-Intermarket Analysis
- MurphyExplainsMarketAnalysis-Visual Analysis
- StockCharts.com
- Technical Analysis of the Financial Markets
- The Visual Investor
