HOT TOPICS LIST
- MACD
- Fibonacci
- RSI
- Gann
- ADXR
- Stochastics
- Volume
- Triangles
- Futures
- Cycles
- Volatility
- ZIGZAG
- MESA
- Retracement
- Aroon
INDICATORS LIST
LIST OF TOPICS
PRINT THIS ARTICLE
by Donald W. Pendergast, Jr.
Marvell Technology Group shares are in a bullish weekly trend, handily outperforming most other components in the NASDAQ 100.
Position: Accumulate
Donald W. Pendergast, Jr.
Donald W. Pendergast is a financial markets consultant who offers specialized services to stock brokers and high net worth individuals who seek a better bottom line for their portfolios.
PRINT THIS ARTICLE
TECHNICAL ANALYSIS
MRVL's High Relative Strength Vs. NASDAQ 100
04/02/09 08:59:46 AMby Donald W. Pendergast, Jr.
Marvell Technology Group shares are in a bullish weekly trend, handily outperforming most other components in the NASDAQ 100.
Position: Accumulate
| After making an all-time high of nearly $37 in early 2006, shares of Marvell Technology Group (MRVL) proceeded to sell off hard for nearly three years, minor interim rallies notwithstanding. The stock made a major low in November 2008, along with the rest of the broad market, and has been in a rising trend ever since. Does this stock still have some get-up and go left in it, or is a correction overdue? |

|
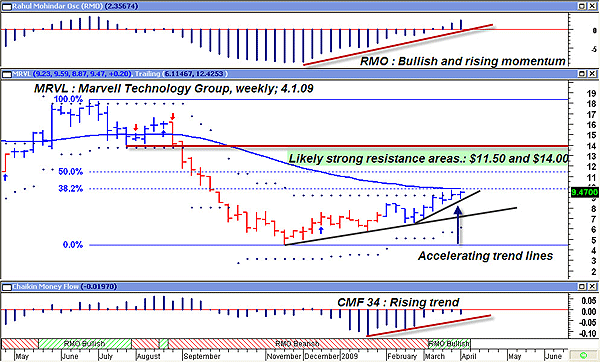
| FIGURE 1: MARVELL, WEEKLY. Given the strong weekly momentum, money flow, and trend characteristics of this stock, buying a May 2009 $9.00 covered call on a weekly close above $9.75 could be a relatively low-risk trade plan. |
| Graphic provided by: MetaStock. |
| Graphic provided by: Rahul Mohindar oscillator (RMO) from Metastock v 1. |
| |
| MRVL's weekly chart (Figure 1) displays a clear uptrend in force, one that is approaching twin resistance barriers — the 50-day exponential moving average (EMA) and the Fibonacci 38.2% retracement level. It almost appears to be one of those "immovable object meets the irresistible force" kind of chart setups that imply an impending battle between the bulls and bears. And here's why. MRVL's weekly momentum, as depicted by the Rahul Mohindar oscillator (RMO), is in a very strong uptrend, one that's also well above its zero-line, and the trendlines on the price chart are beginning the first stage of upward acceleration. Meanwhile, the Chaikin money flow (CMF)(34) is also rising sharply, lending more confidence that this stock has enough fuel remaining to push above the previously mentioned twin resistance levels near $9.75. Should prices close above $9.75 (on a weekly close), the next Fib level (50%) could be the first target, right at $11.40. Beyond that, the price range between $13 and $14 also has a couple of Fibonacci and swing low-resistance barriers. |
| Given the strong 13-week relative strength ranking of MRVL vs. the NASDAQ 100 index (#3 out of 100 stocks) and the very pronounced momentum, trend, and money flow characteristics of this stock, the following trade setup might be worth considering. Buying a May 2009 $9.00 covered call seems to offer a good balance of profit opportunity and risk management, offering an annual rate of return of about 65% if the stock is called away at expiration. This $9.00 call option is in-the-money (ITM), so it affords much more staying power in case of a minor reversal than would an out-of-the-money (OTM) $10 call option, one that is composed solely of time value. Here's the trade plan: on a weekly close above the 50-period EMA, buy the $9.00 covered call for no more than $850 (8.50) and use the latest uptrend line as an ad-hoc stop-loss; a close below it means you wind up the trade and bail out with a small loss. If the trade gains traction, simply monitor it week by week until May expiration arrives. If called, you'll end up with about a $50 profit for each covered call purchased; since this is such a low-priced stock, some traders might be able to afford to buy three, four, five, or even more covered calls, depending on their account size and tolerance for risk. |
| High relative strength stocks tend to outperform, so taking the covered call route on MRVL could be a nice, low-risk trade setup for those convinced that the NASDAQ 100 and the technology sector still have some more room to run. |
Donald W. Pendergast is a financial markets consultant who offers specialized services to stock brokers and high net worth individuals who seek a better bottom line for their portfolios.
| Title: | Writer, market consultant |
| Company: | Linear Trading Systems LLC |
| Jacksonville, FL 32217 | |
| Phone # for sales: | 904-239-9564 |
| E-mail address: | lineartradingsys@gmail.com |
Traders' Resource Links | |
| Linear Trading Systems LLC has not added any product or service information to TRADERS' RESOURCE. | |
Click here for more information about our publications!
Comments
Date: 04/07/09Rank: 4Comment:

Request Information From Our Sponsors
- StockCharts.com, Inc.
- Candle Patterns
- Candlestick Charting Explained
- Intermarket Technical Analysis
- John Murphy on Chart Analysis
- John Murphy's Chart Pattern Recognition
- John Murphy's Market Message
- MurphyExplainsMarketAnalysis-Intermarket Analysis
- MurphyExplainsMarketAnalysis-Visual Analysis
- StockCharts.com
- Technical Analysis of the Financial Markets
- The Visual Investor
- VectorVest, Inc.
- Executive Premier Workshop
- One-Day Options Course
- OptionsPro
- Retirement Income Workshop
- Sure-Fire Trading Systems (VectorVest, Inc.)
- Trading as a Business Workshop
- VectorVest 7 EOD
- VectorVest 7 RealTime/IntraDay
- VectorVest AutoTester
- VectorVest Educational Services
- VectorVest OnLine
- VectorVest Options Analyzer
- VectorVest ProGraphics v6.0
- VectorVest ProTrader 7
- VectorVest RealTime Derby Tool
- VectorVest Simulator
- VectorVest Variator
- VectorVest Watchdog
