HOT TOPICS LIST
- MACD
- Fibonacci
- RSI
- Gann
- ADXR
- Stochastics
- Volume
- Triangles
- Futures
- Cycles
- Volatility
- ZIGZAG
- MESA
- Retracement
- Aroon
INDICATORS LIST
LIST OF TOPICS
PRINT THIS ARTICLE
by Ron Walker
The bank rally has led the entire market higher throughout March, but two important patterns may be the driving forces that end this breath-taking rally. A tristar candle pattern formed on the XLF daily chart as a diamond chart pattern emerged on its hourly chart. Will it be enough to stop the bulls in their tracks?
Position: N/A
Ron Walker
Ron Walker is an active trader and technical analyst. He operates an educational website dedicated to the study of Technical Analysis. The website offers free market analysis with daily video presentations and written commentaries. Ron is a video pioneer, being one of the first to utilize the internet producing Technical Analysis videos. His website is thechartpatterntrader.com
PRINT THIS ARTICLE
CHART ANALYSIS
Will A Diamond Break The Banks?
03/31/09 09:04:06 AMby Ron Walker
The bank rally has led the entire market higher throughout March, but two important patterns may be the driving forces that end this breath-taking rally. A tristar candle pattern formed on the XLF daily chart as a diamond chart pattern emerged on its hourly chart. Will it be enough to stop the bulls in their tracks?
Position: N/A
| In late January 2009, I addressed the possibility of a double bottom forming near the $8 level. That speculative pattern failed to follow through on the daily chart of the Financials Select Sector SPDR (XLF), and by mid-February, the bears had pulled the rug out from under XLF as it sank just below $6 by early March. There a bullish falling wedge formed, resulting in a coming-out party for the bulls. XLF quickly catapulted above its 20-day simple moving average (SMA) on renewed optimism of Citigroup (C ) turning profit in 2009. The new bank rally managed to rejuvenate the entire market. |

|
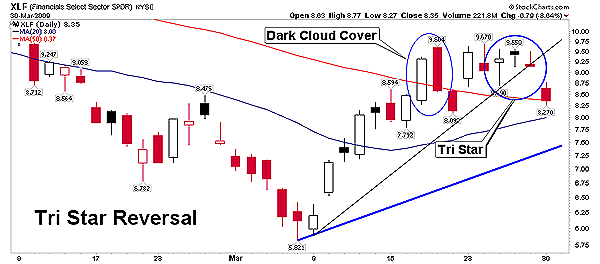
| FIGURE 1: XLF, DAILY. A tristar reversal breaks the daily trendline as a corrective move begins. Note how the second candle in the tristar pattern gaps higher. Prices may find rest on the rising trendline drawn off the original momentum lows (blue line). |
| Graphic provided by: StockCharts.com. |
| |
| In Figure 1, prices continued to rev up, thrusting above the 50-day simple moving average (SMA) but shortly stalled after they plowed into overhead resistance. A two-day dark cloud cover candle pattern formed, taking prices back below the 50-day SMA. But XLF soon gapped higher on renewed confidence in the banks with the announcement of US Treasury Secretary Tim Geithner's toxic-asset plan. The bulls remained unscathed as XLF climbed back up to resistance for another test. At resistance a shooting star appeared, which was followed by a series of dojis. This tristar candle pattern was developed by Steve Nison and is extremely rare. The pattern happens in an uptrend. The pattern is recognizable when three consecutive doji days form, with the second day gapping above the first and third day. The pattern was confirmed on the fourth day as prices gapped lower breaking the rising trendline, resulting in a lower low on the price chart and putting the brakes on this rally. The breakdown of the tristar pattern in combination with the rising trendline being fractured has managed to suck all the oxygen out of the rally for now (Figure 1). |

|
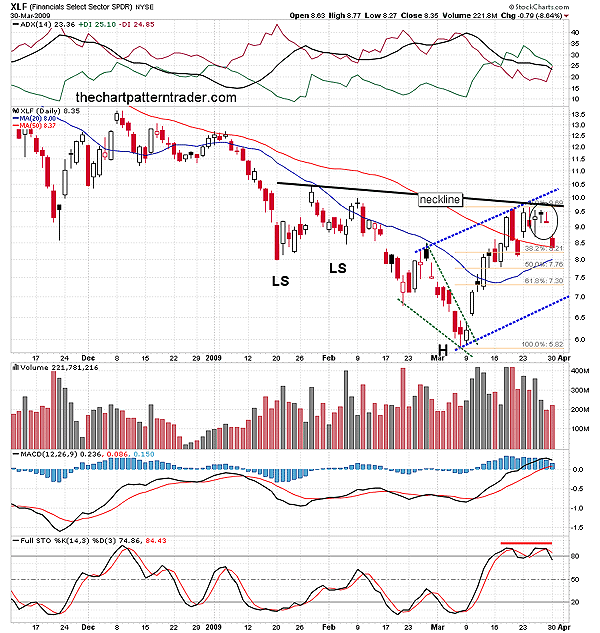
| FIGURE 2: XLF, DAILY. The tristar candle pattern has allowed a neckline to form on the daily chart for a potential inverse complex head & shoulders pattern. Prices may form a higher low and begin to channel higher as two right shoulders make their appearance. |
| Graphic provided by: StockCharts.com. |
| |
| The financial ETF has rallied $3.85 or approximately 66 % off its March 6th low of $5.82, and is overdue for a correction. If XLF can weather the next storm of selling, holding above the March 6th low, it may carve out an inverse complex head & shoulders pattern. XLF could be in the early stages of constructing two right shoulders. In Figure 2, I drew a parallel trendline from peaks made in late February to late March. The hypothetical trendline intersects beautifully with the 61.8 Fibonacci retracement on the daily chart, near $7.30. If that Fibonacci level holds up and a new channel forms, we could see the inverse complex head & shoulders pattern completed and actually play out in the weeks ahead. However, prices should move lower for the short term as the stochastic (14, 3, 3) is tilting below 80 after flat momentum appeared in two equivalent peaks. |

|
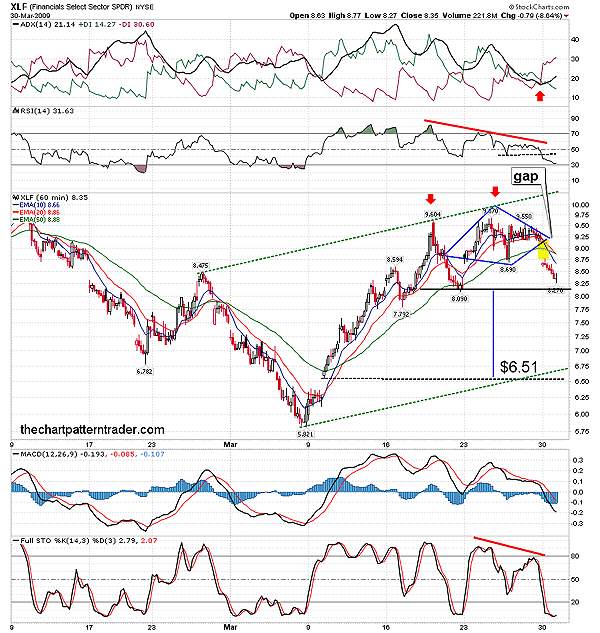
| FIGURE 3: XLF, HOURLY. Here, prices gap lower (in yellow) from the bearish diamond pattern as triple negative divergence begins unraveling on the MACD. Triple negative divergence is three indivdual MACD peaks, stronger than a normal divergence. The diamond may make way for a double-top pattern that measures to the $6.50 area. |
| Graphic provided by: StockCharts.com. |
| |
| The XLF's hourly chart (Figure 3) suggests that prices may be even weaker than the daily chart is letting on, which may cause it to move to the $6.50 level or completely retard prices back to test the March 6th lows. A chart pattern in the form of a diamond reversal appeared on its 60-minute chart as prices shuffled back and forth for several days at the end of March. Finally, on March 30, XLF cut through the clutter and gapped lower. There were several warning signs prior to the price collapse. First of all, XLF formed a triple negative divergence by the three distinct peaks made on the moving average convergence/divergence (MACD). A triple divergence is much more powerful than a normal divergence with just two peaks. Triple and quadruple divergences are by far the most powerful divergence there are. Here, the bears have dragged the MACD back below the zero line, as it is unwinding from triple negative divergence. |
| Earlier, I discuss the possibilities of an inverse complex head & shoulders pattern forming on the daily chart. If that pattern is setting up, this diamond may morph into a double top that could take XLF within the same vicinity of the lower speculative boundary we looked at on the daily chart (see Figure 3). The double-top pattern measures $1.58, with an objective target of $6.51. That would take prices back to the breakaway gap that started this upward journey. So if the bears come back like gangbusters, XLF may produce a full-fledged reversal that will test the gap that occurred on March 10. The hourly charts indicators offer hints that one of these targets discussed may be hit. The directional movement indicator (DMI) got a bearish cross, while the average directional movement index (ADX) bottomed, only to find new-found strength climbing back above 20. This cozy tie between the DMI and the ADX is a very bearish signal and indicates that there is more downside for the financial exchange traded fund (ETF) The relative strength index (RSI) (14) has dipped below 33.33, confirming the end of the current trend. When the RSI is in an upward trend it has swings from 33.33 to 80, rarely dipping below 40. Moreover, the RSI broke below its last minor low, producing a top failure swing. In Figure 3, both the 10- and 20-period exponential moving averages (EMA) have crossed below the 50-period EMA while prices have dropped below all three moving averages. Prior to that, each corrective phase was contained near the 50-period EMA. Prices also got a lower low. If prices bounce off support at $8.09, we may see some type of topping pattern form something along the lines of a triple top. But if that level of support is violated, the diamond top may serve as the second peak in a double-top pattern, with the $8.09 low being the confirmation line. The first peak was pointed, with almost a climatic top to it, while the second peak is more rounded, with the two gaps that form the boundaries of the diamond mark an island reversal. If XLF remains above its March 6th low, putting in a higher low, then XLF may be chiseling out a new rising price channel. If prices test that low or fall below it, then the inverse complex head & shoulders pattern we discussed would be nullified and ineffective. |
Ron Walker is an active trader and technical analyst. He operates an educational website dedicated to the study of Technical Analysis. The website offers free market analysis with daily video presentations and written commentaries. Ron is a video pioneer, being one of the first to utilize the internet producing Technical Analysis videos. His website is thechartpatterntrader.com
| Website: | thechartpatterntrader.com |
| E-mail address: | thechartpatterntrader@gmail.com |
Click here for more information about our publications!
Comments
Date: 03/31/09Rank: 4Comment:

Request Information From Our Sponsors
- VectorVest, Inc.
- Executive Premier Workshop
- One-Day Options Course
- OptionsPro
- Retirement Income Workshop
- Sure-Fire Trading Systems (VectorVest, Inc.)
- Trading as a Business Workshop
- VectorVest 7 EOD
- VectorVest 7 RealTime/IntraDay
- VectorVest AutoTester
- VectorVest Educational Services
- VectorVest OnLine
- VectorVest Options Analyzer
- VectorVest ProGraphics v6.0
- VectorVest ProTrader 7
- VectorVest RealTime Derby Tool
- VectorVest Simulator
- VectorVest Variator
- VectorVest Watchdog
- StockCharts.com, Inc.
- Candle Patterns
- Candlestick Charting Explained
- Intermarket Technical Analysis
- John Murphy on Chart Analysis
- John Murphy's Chart Pattern Recognition
- John Murphy's Market Message
- MurphyExplainsMarketAnalysis-Intermarket Analysis
- MurphyExplainsMarketAnalysis-Visual Analysis
- StockCharts.com
- Technical Analysis of the Financial Markets
- The Visual Investor
