HOT TOPICS LIST
- MACD
- Fibonacci
- RSI
- Gann
- ADXR
- Stochastics
- Volume
- Triangles
- Futures
- Cycles
- Volatility
- ZIGZAG
- MESA
- Retracement
- Aroon
INDICATORS LIST
LIST OF TOPICS
PRINT THIS ARTICLE
by Donald W. Pendergast, Jr.
Unlike most stocks, Abbott Labs only recently made its major low. Is this stock staging a turnaround, or is this latest rally a fakeout?
Position: Accumulate
Donald W. Pendergast, Jr.
Donald W. Pendergast is a financial markets consultant who offers specialized services to stock brokers and high net worth individuals who seek a better bottom line for their portfolios.
PRINT THIS ARTICLE
KELTNER CHANNELS
ABT Anticipating A Move Higher After Support Test
03/31/09 11:38:11 AMby Donald W. Pendergast, Jr.
Unlike most stocks, Abbott Labs only recently made its major low. Is this stock staging a turnaround, or is this latest rally a fakeout?
Position: Accumulate
| Abbott Laboratories stock (ABT) has fared better than most others during the course of the current 18-month-long bear market, but its performance during the March 2009 rally has been a bit sluggish. Not that it's a poor trading candidate, it's just that this stock seems to be slowly preparing for a more sustained move at a later date. Right now, however, a fresh swing trade buy signal has printed, offering skilled traders the potential for a fairly quick gain if the broad markets resume their uptrend. |

|
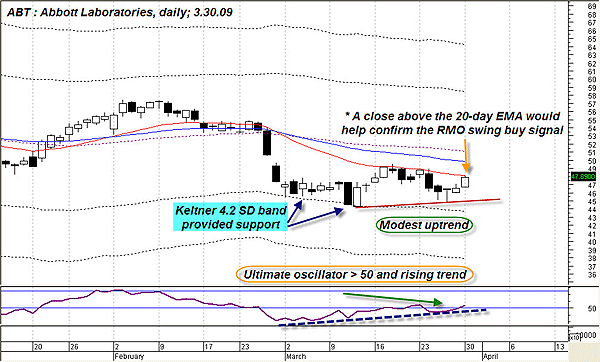
| FIGURE 1: ABT, DAILY. A noticeable reversal off a lower Keltner band has been followed by a higher low and a minor uptrend. The 20-day and 50-day EMAs are the next resistance areas. |
| Graphic provided by: MetaStock. |
| |
| Figure 1 shows how one of the lower Keltner bands (set at 4.2 standard deviations) acted as solid support on two occasions before the price reversed higher. ABT shares then stalled at the downward-sloping 20-day exponential moving average (EMA), drifting a little lower, before finally finding solid support near $44.75. Once again, prices have turned higher, and the 20-day EMA is still acting as a resistance barrier. Another positive technical measurement is the current posture of the ultimate oscillator (UO). This indicator uses a weighted mix of a seven-, 14-, and 28-period cyclical momentum calculation in order to help traders ascertain divergences and general market turning points. Here, we see that the trend of the UO is up and that it has also broken above the 50 level. The overall image is bullish, however, and for the moment, the line of least resistance appears to be higher. We'll look at one more daily chart to get a slightly different take on ABT and then consider a possible swing trade setup. |

|
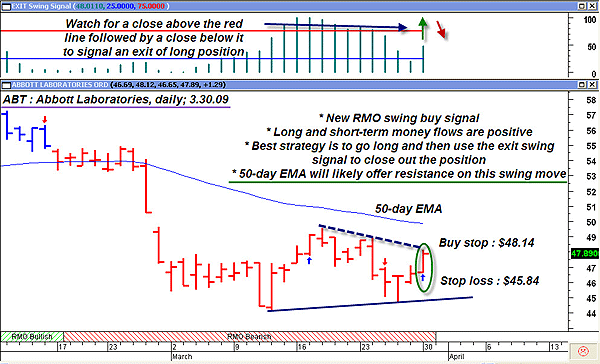
| FIGURE 2: ABT, DAILY. A breakout out of the pennant could be a very bullish event; traders going long here need to consider taking profits based on the action of the exit swing indicator. |
| Graphic provided by: MetaStock. |
| Graphic provided by: Rahul Mohindar indicators from MetaStock v 10.1. |
| |
| Shifting over to a modified RMO swing trade template, we can see the fresh Rahul Mohindar (RMO) swing buy signal and a minor pennant formation on the verge of a bullish breakout (Figure 2). Since we've already confirmed that ABT has indeed found meaningful support (the Keltner reversal and the higher low) and that the UO and money flows are supportive of a bullish move, we can act with more confidence on this swing buy signal. On a buy-stop entry at $48.14, the breakout will be a go and the next move is to watch the exit swing signal indicator (see the top pane of chart) for clues that the swing move is getting overextended. The general idea is to wait for the exit swing indicator to rise above the red signal line on a close and to then drop below the same line on a close. However, since this trade setup will face likely resistance near the 50-day EMA, it might be more prudent to take half off there and to then trail the rest of the position with a three-bar trailing stop of the lows. Of course, every trade needs an initial stop-loss, too, so the $45.84 area should be a reasonable choice based on chart swing structure and the risk/reward ratio. |
| Will the broad markets find fresh support within the next few sessions, offering setups like the one above a fighting chance for success? Who knows, but the fact is that 80% of all stocks follow the broad market's moves, both up and down. ABT has a six-month correlation of 0.66 with the Standard & Poor's 500, so it's definitely affected by the swings and shakeouts in this major index. A new upswing in this index will definitely have a favorable influence on this ABT swing/breakout setup. |
Donald W. Pendergast is a financial markets consultant who offers specialized services to stock brokers and high net worth individuals who seek a better bottom line for their portfolios.
| Title: | Writer, market consultant |
| Company: | Linear Trading Systems LLC |
| Jacksonville, FL 32217 | |
| Phone # for sales: | 904-239-9564 |
| E-mail address: | lineartradingsys@gmail.com |
Traders' Resource Links | |
| Linear Trading Systems LLC has not added any product or service information to TRADERS' RESOURCE. | |
Click here for more information about our publications!
Comments
Date: 03/31/09Rank: 3Comment:

Request Information From Our Sponsors
- StockCharts.com, Inc.
- Candle Patterns
- Candlestick Charting Explained
- Intermarket Technical Analysis
- John Murphy on Chart Analysis
- John Murphy's Chart Pattern Recognition
- John Murphy's Market Message
- MurphyExplainsMarketAnalysis-Intermarket Analysis
- MurphyExplainsMarketAnalysis-Visual Analysis
- StockCharts.com
- Technical Analysis of the Financial Markets
- The Visual Investor
- VectorVest, Inc.
- Executive Premier Workshop
- One-Day Options Course
- OptionsPro
- Retirement Income Workshop
- Sure-Fire Trading Systems (VectorVest, Inc.)
- Trading as a Business Workshop
- VectorVest 7 EOD
- VectorVest 7 RealTime/IntraDay
- VectorVest AutoTester
- VectorVest Educational Services
- VectorVest OnLine
- VectorVest Options Analyzer
- VectorVest ProGraphics v6.0
- VectorVest ProTrader 7
- VectorVest RealTime Derby Tool
- VectorVest Simulator
- VectorVest Variator
- VectorVest Watchdog
