HOT TOPICS LIST
- MACD
- Fibonacci
- RSI
- Gann
- ADXR
- Stochastics
- Volume
- Triangles
- Futures
- Cycles
- Volatility
- ZIGZAG
- MESA
- Retracement
- Aroon
INDICATORS LIST
LIST OF TOPICS
PRINT THIS ARTICLE
by Donald W. Pendergast, Jr.
Molson Coors Brewing may be pausing before attempting another leg higher.
Position: Accumulate
Donald W. Pendergast, Jr.
Donald W. Pendergast is a financial markets consultant who offers specialized services to stock brokers and high net worth individuals who seek a better bottom line for their portfolios.
PRINT THIS ARTICLE
AROON
Is Bullish Breakout Brewing For TAP?
03/30/09 09:04:57 AMby Donald W. Pendergast, Jr.
Molson Coors Brewing may be pausing before attempting another leg higher.
Position: Accumulate
| Some pundits assert that during times of recession and/or depression, churches, movie theaters and bars all tend to fill up as anxious people look for places of temporary relief from the storms of life, but you'd never be able to prove the last part of that assertion judging from the recent price action in Molson Coors Brewing (TAP) shares. The shares are down about 45% from the May 2008 highs, only having recently found a meaningful low with the rest of the broad market indexes. Recently, however, the stock has been exhibiting the most bullish price action since November–December 2008 and now appears to be at a critical point. Let's glance at two charts to determine if TAP is ready to roll over or whether it's simply catching its breath before moving higher. |

|
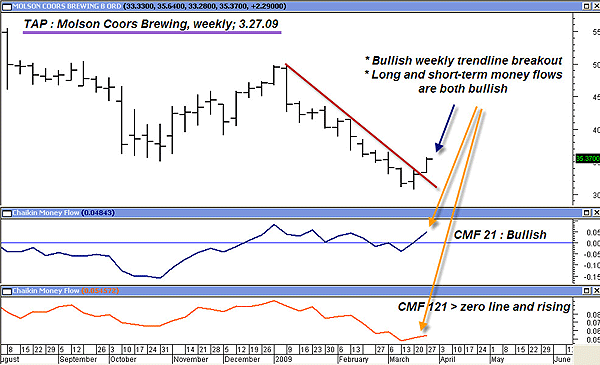
| FIGURE 1: TAP, WEEKLY. Nuthin' fancy here, just simple geometry and positive long- and short-term weekly money flows. |
| Graphic provided by: MetaStock. |
| |
| Figure 1, TAP's weekly graph, shows a very solid-looking bullish trendline breakout, one occurring at the same time that the Chaikin money flows in both the 21- and 120-day time periods are above their zero lines and/or are manifesting bullish confirmation of the latest rally. The next major chart resistance is near $42, more than $6.00 away from the current price, while the next meaningful Fibonacci resistance won't happen until price approaches the $38 area. Overall, it's a bullish image presented here and if the broad markets can follow through on March's astounding turnaround, TAP should have no problem hitting at least one of those previously mentioned resistance targets. |

|
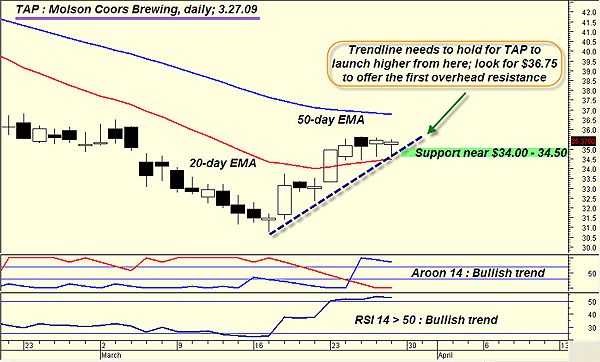
| FIGURE 2: TAP, DAILY. The trend is bullish, as confirmed by both the Aroon (14) and RSI (14). Other bullish confirmations include a three-point rising trendline and a 20-period EMA acting as solid support; note the long lower shadows on the last three daily candles. |
| Graphic provided by: MetaStock. |
| |
| TAP's daily chart, Figure 2, more clearly depicts the stock at a "pause" stage; given the positive trend dynamics on the higher time frame chart and the successful retest of the 20-day exponential moving average (EMA) (resistance now acting as support; note the long lower shadows on the last three daily candles, which imply that the $34.50 area near the 20-day EMA is significant support), the odds are that TAP will attempt some sort of a continuation move higher, possibly rising to challenge the 50-day EMA near $36.75. Lending credence to this outlook is the bullish Aroon (14) indicator trend and the relative strength index (RSI) (14) reading above 50. Both are in agreement that the trend is strong — for now. One way to play this setup is to wait for an intraday pullback toward the up trendline, buying half your position if prices approach the line and then reverse higher. Then wait for a daily breakout above Friday's high (setting a buy stop near $35.51) to acquire the second half of your position. The initial stop for the whole deal should be just below the confluence of the 20-day EMA and the up trendline, perhaps near $34.45. This should offer a good risk to reward ratio for this potential swing trade setup. |
| Although technical analysis is an imperfect science and at times can be very frustrating to work with, it's usually a safe bet to expect some pronounced moves in a stock when it becomes trapped in between its 20-period EMA and its 50-period EMA, just as TAP is right now. In fact, sometimes the area between the 50-period EMA and the 200-period EMA can frequently be a zone in which to expect significant swing moves, as the bulls and bears attack each other in a quest for market dominance. As always, analyzing higher time frame trends and money flows can help give you an edge when deciding what kind of a position to establish on the lower time frames you normally trade. |
Donald W. Pendergast is a financial markets consultant who offers specialized services to stock brokers and high net worth individuals who seek a better bottom line for their portfolios.
| Title: | Writer, market consultant |
| Company: | Linear Trading Systems LLC |
| Jacksonville, FL 32217 | |
| Phone # for sales: | 904-239-9564 |
| E-mail address: | lineartradingsys@gmail.com |
Traders' Resource Links | |
| Linear Trading Systems LLC has not added any product or service information to TRADERS' RESOURCE. | |
Click here for more information about our publications!
Comments
Date: 03/30/09Rank: 5Comment:

Request Information From Our Sponsors
- StockCharts.com, Inc.
- Candle Patterns
- Candlestick Charting Explained
- Intermarket Technical Analysis
- John Murphy on Chart Analysis
- John Murphy's Chart Pattern Recognition
- John Murphy's Market Message
- MurphyExplainsMarketAnalysis-Intermarket Analysis
- MurphyExplainsMarketAnalysis-Visual Analysis
- StockCharts.com
- Technical Analysis of the Financial Markets
- The Visual Investor
- VectorVest, Inc.
- Executive Premier Workshop
- One-Day Options Course
- OptionsPro
- Retirement Income Workshop
- Sure-Fire Trading Systems (VectorVest, Inc.)
- Trading as a Business Workshop
- VectorVest 7 EOD
- VectorVest 7 RealTime/IntraDay
- VectorVest AutoTester
- VectorVest Educational Services
- VectorVest OnLine
- VectorVest Options Analyzer
- VectorVest ProGraphics v6.0
- VectorVest ProTrader 7
- VectorVest RealTime Derby Tool
- VectorVest Simulator
- VectorVest Variator
- VectorVest Watchdog
