HOT TOPICS LIST
- MACD
- Fibonacci
- RSI
- Gann
- ADXR
- Stochastics
- Volume
- Triangles
- Futures
- Cycles
- Volatility
- ZIGZAG
- MESA
- Retracement
- Aroon
INDICATORS LIST
LIST OF TOPICS
PRINT THIS ARTICLE
by Donald W. Pendergast, Jr.
Teradata shares have had a nice six-week run, and its nearly perfect bullish flag pattern may be signaling even higher prices to come.
Position: Buy
Donald W. Pendergast, Jr.
Donald W. Pendergast is a financial markets consultant who offers specialized services to stock brokers and high net worth individuals who seek a better bottom line for their portfolios.
PRINT THIS ARTICLE
FLAGS AND PENNANTS
Teradata's Bullish Flag Pattern
03/27/09 10:59:12 AMby Donald W. Pendergast, Jr.
Teradata shares have had a nice six-week run, and its nearly perfect bullish flag pattern may be signaling even higher prices to come.
Position: Buy
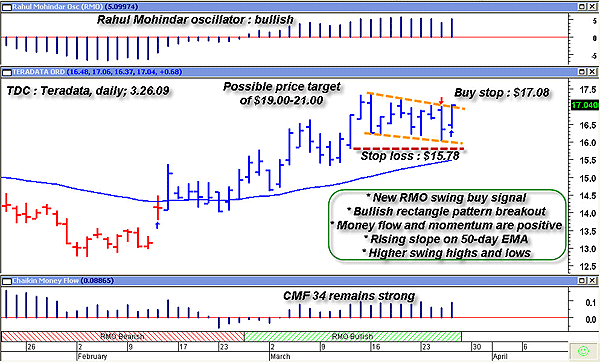
| Teradata Corp.'s (TDC) stock has risen about 35% since making a daily cycle low in early February 2009. A series of higher swing highs and lows, bullish momentum and money flow readings, and a 50-day exponential moving average (EMA) with a rising slope have all combined to confirm the bullish trend in this stock. Of even greater interest is the new Rahul Mohindar (RMO) swing buy signal, one that coincided with a bullish breakout of a nearly textbook-quality bullish rectangle pattern. It's just a beautiful pattern, and the manner in which it's situated above that rising 50-day EMA seems to imply that the fledgling breakout may have a much greater than average chance of success. An added confidence booster is that TDC's 13-week rate of change is significantly outperforming that of the Standard & Poor's 500. (See Figure 1.) Given the series of minor swings leading up to the rectangle, calculating the potential price target for a bullish breakout will require a little "Kentucky Windage" (an idiom, meaning common sense in the absence of perfect knowledge in the midst of a perplexing situation), but it's safe to say that $19 to $21 is a general anticipated price target if the breakout catches a bid and a fresh wave of traders pile into this stock. If the breakout turns out to be a fakeout, placing an initial stop-loss just below the lower channel of the rectangle near a prior minor support level ($15.78) should offer a decent insurance policy in case things start to get out of hand. |

|
| FIGURE 1: TDC, DAILY. Breakouts from flags, rectangles, and pennants don't always work out, but when they occur in the midst of an overwhelmingly bullish setting, the odds of making a successful breakout entry are enhanced. |
| Graphic provided by: MetaStock. |
| Graphic provided by: Rahul Mohindar oscillator from Metastock v 10.1. |
| |
| There isn't any significant overhead resistance from prior swing highs/lows until the $25 area, but there are two Fibonacci resistance zones to be challenged, one near $18.50 and the other near $20.35. Swing traders going long on a buy-stop from $17.08 may wish to take partial profits if either of those Fibonacci zones are reached, trailing the balance of the position with a three- to four-bar trailing stop of the lows. |
| Not every textbook-quality chart pattern proves out, but when such a pattern occurs within the context of an overwhelmingly bullish technical backdrop, a trader can enter such a breakout setup with a relatively high degree of confidence. Given that TDC is outperforming the majority of S&P 500 stocks and that the broad markets are still rallying, taking a long entry here on TDC looks like a worthy proposition. |
Donald W. Pendergast is a financial markets consultant who offers specialized services to stock brokers and high net worth individuals who seek a better bottom line for their portfolios.
| Title: | Writer, market consultant |
| Company: | Linear Trading Systems LLC |
| Jacksonville, FL 32217 | |
| Phone # for sales: | 904-239-9564 |
| E-mail address: | lineartradingsys@gmail.com |
Traders' Resource Links | |
| Linear Trading Systems LLC has not added any product or service information to TRADERS' RESOURCE. | |
Click here for more information about our publications!
Comments
Date: 03/30/09Rank: 3Comment:

Request Information From Our Sponsors
- StockCharts.com, Inc.
- Candle Patterns
- Candlestick Charting Explained
- Intermarket Technical Analysis
- John Murphy on Chart Analysis
- John Murphy's Chart Pattern Recognition
- John Murphy's Market Message
- MurphyExplainsMarketAnalysis-Intermarket Analysis
- MurphyExplainsMarketAnalysis-Visual Analysis
- StockCharts.com
- Technical Analysis of the Financial Markets
- The Visual Investor
- VectorVest, Inc.
- Executive Premier Workshop
- One-Day Options Course
- OptionsPro
- Retirement Income Workshop
- Sure-Fire Trading Systems (VectorVest, Inc.)
- Trading as a Business Workshop
- VectorVest 7 EOD
- VectorVest 7 RealTime/IntraDay
- VectorVest AutoTester
- VectorVest Educational Services
- VectorVest OnLine
- VectorVest Options Analyzer
- VectorVest ProGraphics v6.0
- VectorVest ProTrader 7
- VectorVest RealTime Derby Tool
- VectorVest Simulator
- VectorVest Variator
- VectorVest Watchdog
