HOT TOPICS LIST
- MACD
- Fibonacci
- RSI
- Gann
- ADXR
- Stochastics
- Volume
- Triangles
- Futures
- Cycles
- Volatility
- ZIGZAG
- MESA
- Retracement
- Aroon
INDICATORS LIST
LIST OF TOPICS
PRINT THIS ARTICLE
by James Kupfer
The US dollar may be starting to move up within a Fibonacci arc pattern.
Position: N/A
James Kupfer
Mr. Kupfer is a market professional and amateur stock market commentator. Disclosure: It is likely that Mr. Kupfer has or will enter a position in any security he writes about.
PRINT THIS ARTICLE
FIBONACCI
Dollar On The Move
03/27/09 08:38:41 AMby James Kupfer
The US dollar may be starting to move up within a Fibonacci arc pattern.
Position: N/A
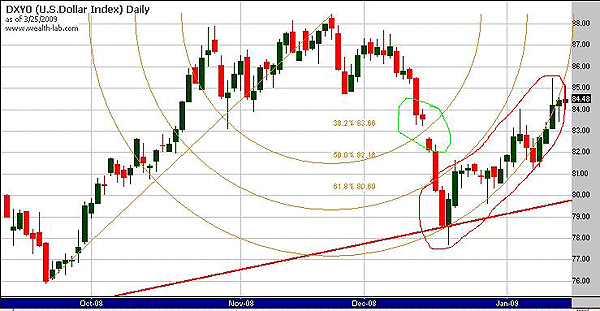
| Before moving to the current setup, let us take a look at an example of a Fibonacci arc on the dollar that occurred recently. Drawing a line between the September low and the November high with a Fibonacci arc tool creates the lines shown in Figure 1. After the November peak, the dollar started to move down until it reached the 38.2% retracement arc level. It then proceeded to gap down and started to free fall until it reached the 61.8% retracement arc level. Once the dollar bottomed, it started moving back up and, for the most part, stayed within the 50% and 61.8% arc lines. |

|
| FIGURE 1: US DOLLAR, DAILY. Drawing a line between the September low and the November high with a Fibonacci arc tool created the lines shown here. |
| Graphic provided by: Wealth-Lab. |
| |
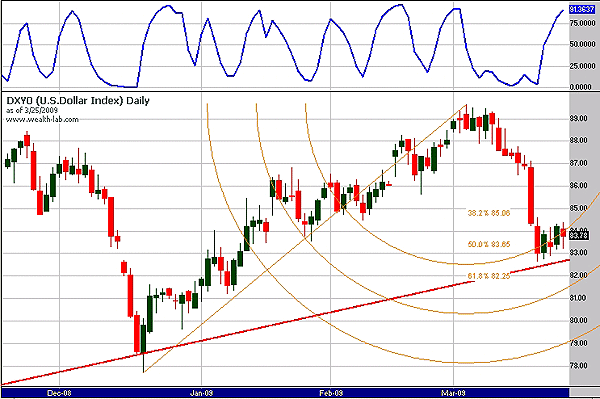
| Fast forward to today (Figure 2). Since reaching a peak earlier this month, the dollar has dropped rapidly until stopping at the resistance zone formed by the 38.2% Fibonacci arc line. Stochastics are significantly overbought so the dollar may be ready to move further down. However, if the dollar can hold above the red trendline, it may start to move up once it hits the 50% retracement arc line. |
| Should the dollar fail to hold 50%, watch for support at the 61.8% arc line. This would present a situation similar to what happened in Figure 2. And since the dollar has been moving in a pattern of higher lows and higher highs, the trend is still up and we may be near a good buy point. |

|
| FIGURE 2: US DOLLAR, DAILY. Since reaching a peak earlier in March, the dollar has dropped rapidly until stopping at the resistance zone formed by the 38.2% Fibonacci arc line. |
| Graphic provided by: Wealth-Lab. |
| |
Mr. Kupfer is a market professional and amateur stock market commentator. Disclosure: It is likely that Mr. Kupfer has or will enter a position in any security he writes about.
Click here for more information about our publications!
Comments
Date: 03/30/09Rank: 4Comment:

Request Information From Our Sponsors
- StockCharts.com, Inc.
- Candle Patterns
- Candlestick Charting Explained
- Intermarket Technical Analysis
- John Murphy on Chart Analysis
- John Murphy's Chart Pattern Recognition
- John Murphy's Market Message
- MurphyExplainsMarketAnalysis-Intermarket Analysis
- MurphyExplainsMarketAnalysis-Visual Analysis
- StockCharts.com
- Technical Analysis of the Financial Markets
- The Visual Investor
- VectorVest, Inc.
- Executive Premier Workshop
- One-Day Options Course
- OptionsPro
- Retirement Income Workshop
- Sure-Fire Trading Systems (VectorVest, Inc.)
- Trading as a Business Workshop
- VectorVest 7 EOD
- VectorVest 7 RealTime/IntraDay
- VectorVest AutoTester
- VectorVest Educational Services
- VectorVest OnLine
- VectorVest Options Analyzer
- VectorVest ProGraphics v6.0
- VectorVest ProTrader 7
- VectorVest RealTime Derby Tool
- VectorVest Simulator
- VectorVest Variator
- VectorVest Watchdog
