HOT TOPICS LIST
- MACD
- Fibonacci
- RSI
- Gann
- ADXR
- Stochastics
- Volume
- Triangles
- Futures
- Cycles
- Volatility
- ZIGZAG
- MESA
- Retracement
- Aroon
INDICATORS LIST
LIST OF TOPICS
PRINT THIS ARTICLE
by Chaitali Mohile
The extensive bullish rally in Apple has surged above its upper Bollinger band. Will the rally continue?
Position: Buy
Chaitali Mohile
Active trader in the Indian stock markets since 2003 and a full-time writer. Trading is largely based upon technical analysis.
PRINT THIS ARTICLE
TECHNICAL ANALYSIS
Apple Above Upper Bollinger Band
03/27/09 10:28:29 AMby Chaitali Mohile
The extensive bullish rally in Apple has surged above its upper Bollinger band. Will the rally continue?
Position: Buy
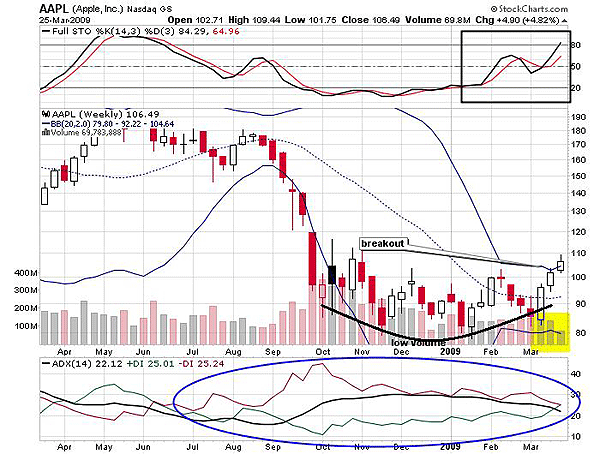
| When a stock moves above an upper Bollinger band, a fresh buying opportunity is generated. If price moves below a lower Bollinger band, traders can bet on a short sell. The three weeks' bullish rally in Apple Inc. (AAPL) breached an upper Bollinger band. Technically, traders can strike a long trade. The full stochastic (14,3,3) has gradually moved into an overbought zone, indicating the stability of the rally. The average directional movement index (ADX) (14) is indicating a declining downtrend in Figure 1. So both the indicators are suggesting that AAPL can be bought at the current levels. |

|
| FIGURE 1: AAPL, WEEKLY. The reducing low during the rally is highlighted with a yellow square. The rally has moved above the upper Bollinger band. |
| Graphic provided by: StockCharts.com. |
| |
| But the volume in Figure 1 is not encouraging. As the rally moved higher, volume dried up indicating a lack of confidence. The shrinking size of the candlesticks reflects weakening strength in the rally. The candle that has surged above the upper Bollinger band is small compared to the first candle of the rally. Therefore, traders must be alert. |

|
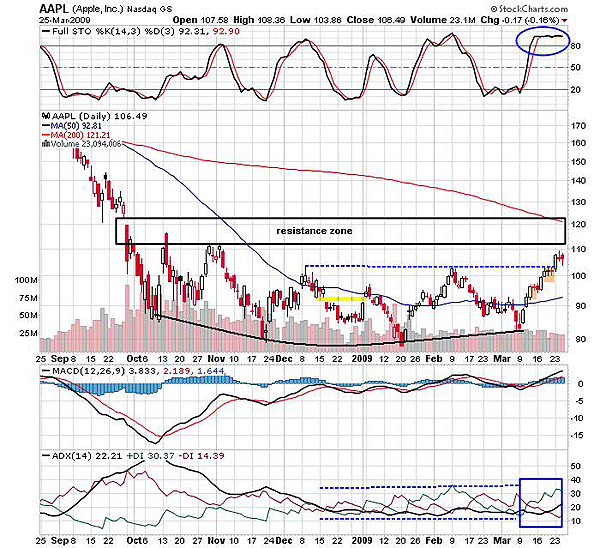
| FIGURE 2: AAPL, DAILY. We can see at the rounded bottom that a bearish reversal pattern formed. The stock is approaching the previous high-resistance area. |
| Graphic provided by: StockCharts.com. |
| |
| Figure 2 shows the previous high-resistance areas between $110 and $120. After plunging to $90, AAPL consolidated in a volatile range of $110 and $80. A rounded bottom was formed during consolidation, but the breakout has not yet been confirmed. However, the advance rally that began on March 9 consolidated at every resistance level like the one above $90. During consolidation, AAPL formed a small doji, indicating indecision and uncertainty. The colored rectangles above $90 and $100 in Figure 2 show sideways price movements. The stock accumulated strength and continued to move higher. |
| Currently, AAPL is consolidating near the first previous high resistance at $110. Let us verify the indicators in Figure 2 to determine the stability of the rally. The stochastic oscillator (14,3,3) has turned flat in an overbought territory, indicating sufficient room for an upward rally. The ADX (14) that was indicating consolidation earlier (see the dashed-line area) has moved in an uptrend. The increased buying pressure dragged the ADX above 20, suggesting a developing uptrend. In addition, the moving average convergence/divergence (MACD) (12,26,9) shows bullish crossover with the support of the zero line (see Figure 2). |
| Thus, all the three indicators are healthily bullish and indicate strength in an upward rally. The rally that is consolidating currently would soon break upward and resume a bullish move. Therefore, traders can enter a long position after the bullish breakout as per daily time frame. |
Active trader in the Indian stock markets since 2003 and a full-time writer. Trading is largely based upon technical analysis.
| Company: | Independent |
| Address: | C1/3 Parth Indraprasth Towers. Vastrapur |
| Ahmedabad, Guj 380015 | |
| E-mail address: | chaitalimohile@yahoo.co.in |
Traders' Resource Links | |
| Independent has not added any product or service information to TRADERS' RESOURCE. | |
Click here for more information about our publications!
PRINT THIS ARTICLE

Request Information From Our Sponsors
- StockCharts.com, Inc.
- Candle Patterns
- Candlestick Charting Explained
- Intermarket Technical Analysis
- John Murphy on Chart Analysis
- John Murphy's Chart Pattern Recognition
- John Murphy's Market Message
- MurphyExplainsMarketAnalysis-Intermarket Analysis
- MurphyExplainsMarketAnalysis-Visual Analysis
- StockCharts.com
- Technical Analysis of the Financial Markets
- The Visual Investor
- VectorVest, Inc.
- Executive Premier Workshop
- One-Day Options Course
- OptionsPro
- Retirement Income Workshop
- Sure-Fire Trading Systems (VectorVest, Inc.)
- Trading as a Business Workshop
- VectorVest 7 EOD
- VectorVest 7 RealTime/IntraDay
- VectorVest AutoTester
- VectorVest Educational Services
- VectorVest OnLine
- VectorVest Options Analyzer
- VectorVest ProGraphics v6.0
- VectorVest ProTrader 7
- VectorVest RealTime Derby Tool
- VectorVest Simulator
- VectorVest Variator
- VectorVest Watchdog
