HOT TOPICS LIST
- MACD
- Fibonacci
- RSI
- Gann
- ADXR
- Stochastics
- Volume
- Triangles
- Futures
- Cycles
- Volatility
- ZIGZAG
- MESA
- Retracement
- Aroon
INDICATORS LIST
LIST OF TOPICS
PRINT THIS ARTICLE
by Donald W. Pendergast, Jr.
Daytrading can be a very profitable occupation, but some mental and tactical adjustments are necessary for those used to the slower pace of daily or weekly based trading.
Position: N/A
Donald W. Pendergast, Jr.
Donald W. Pendergast is a financial markets consultant who offers specialized services to stock brokers and high net worth individuals who seek a better bottom line for their portfolios.
PRINT THIS ARTICLE
DAY TRADING
GDX And Its Adventures In Daytrading
03/26/09 11:51:35 AMby Donald W. Pendergast, Jr.
Daytrading can be a very profitable occupation, but some mental and tactical adjustments are necessary for those used to the slower pace of daily or weekly based trading.
Position: N/A
| Here's the general game plan that a trader was able to deploy on a fairly low-risk daytrade setup today. We'll start with a top-down technical analysis of the tradable involved -- the Market Vectors Gold Miners exchange traded fund (ETF) (GDX) -- and then get down to the nuts and bolts of the actual intraday action. To start, let's begin with the trader's belief system, one that is firmly biased toward an ongoing bull market in the precious metals markets and their related mining shares. Every trader, even those who trade mechanical systems, have a distinct bias regarding the markets that they trade, whether they want to admit to it, and it pays to at least acknowledge and accommodate such belief systems before interacting with the markets, no matter if a mechanical or discretionary (or combination of both) trading method is deployed. |

|
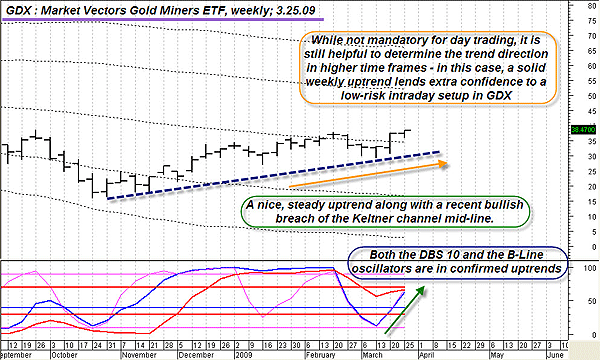
| FIGURE 1: GDX, WEEKLY. Ascertaining the trend direction of the higher time frames in the markets you follow can help add an extra measure of confidence when placing shorter-term intraday trades. |
| Graphic provided by: MetaStock. |
| Graphic provided by: WB EOD indicators from ProfitTrader for MetaStock. |
| |
| Next, an analysis of the general trend of the market (GDX) was made; looking at Figure 1, you can see that both the weekly cycle indicator (the blue DBS 10 line) and the weekly B-line oscillator (the red line) were both in confirmed uptrends and that the general trend of GDX is higher. The recent bullish breach of the Keltner channel midline is an especially bullish development, one that helps lend a high degree of confidence for a possible lower time frame trade entry. For the record, GDX's daily chart (not shown) is equally bullish. Now let's drop down to the GDX 15-minute intraday chart and use it to help time a long trade entry using a three-minute intraday chart on the same stock. |

|
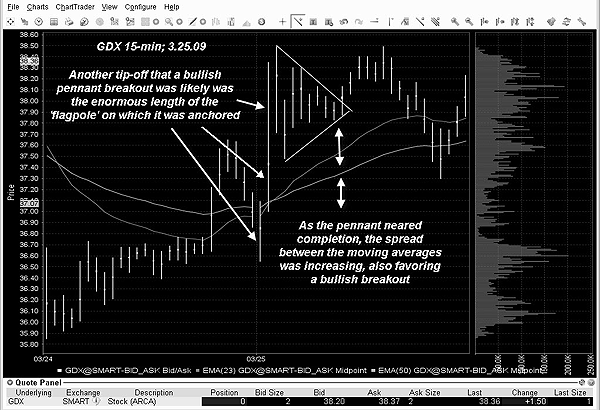
| FIGURE 2: GDX, 15-MINUTE. An enormous flagpole, a well-defined pennant formation, and increasing EMA spreads all suggest the likelihood of a successful bullish breakout. |
| Graphic provided by: Interactive Brokers 15-minute intraday chart. |
| |
| The well-formed pennant on the 15-minute GDX chart (Figure 2), the one hanging on the flagpole that printed as GDX launched higher right from the start of today's session, was the primary focus that led to the intraday entry in question. Since the trend in the daily and weekly time frames was up, the expectation was for the pennant to break out to the upside. Since the spread between the 23-period exponential moving average (EMA) and the 50-period EMA was increasing the entire time that the pennant was forming (confirming an uptrend in this time frame as well), it was decided to drill down to the three-minute GDX chart in hopes of fine-tuning a possible long entry on a breakout move. |

|
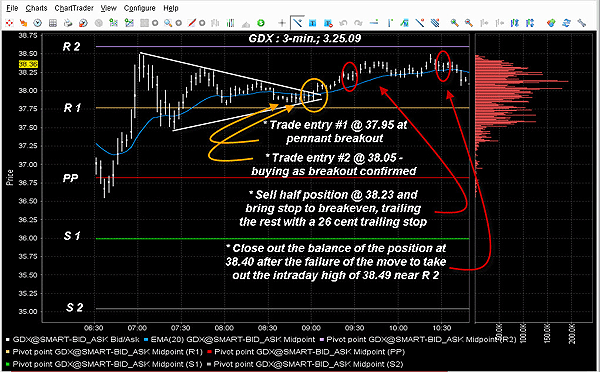
| FIGURE 3: GDX, THREE-MINUTE. Given the bullish bias of the 15-minute chart, the successful cross above R1, followed by two successful support tests of the same on this three-minute chart, helped to make a long breakout entry a very low-stress proposition. |
| Graphic provided by: Interactive Brokers 3-minute intraday chart. |
| |
| The three-minute GDX chart (Figure 3) provided even more technical goodies to confirm that prices had a very high probability of moving higher; first off, the stock spent 95% of its time up to the pennant breakout point (0902 Pacific time [PT]) above the daily pivot point, which is the red horizontal line labeled PP. Even better, due to the strong morning runup, GDX had broken above and successfully retested R1 as support, even as the price bars were gradually constricting, coiling tightly within the pennant. Finally, the moment of truth: prices surged, hitting the buy-stop of 37.95 for a long entry of half the position; waiting a couple of extra minutes also allowed the second buy-stop at 38.05 to get filled. Immediately, a stop-loss order for the entire long position was placed just below R1 at 37.73 to limit the risk in case the breakout failed. Since a wise trader will normally sell part of his position into strength once a breakout has confirmed its validity, half the position was taken off at 38.23 and the stop-loss was moved up to break even (the average cost of both entries plus $2 in commissions). At this point the trade was a breeze to manage, since it was now a risk-free trade, one that could be trailed by a modest amount (in this case $0.26) until the anticipated retest of the intraday high at 38.49 occurred. That retest happened at about 1020 PT, and it was already decided that unless prices quickly moved above that level, the wisest course of action was to simply close out the trade. The fact that R2 was still looming overhead was also a contributing factor in deciding to bail if 38.49 couldn't be breached on this particular swing. So the final half of the GDX long position was liquidated at 38.40 a few minutes later. The net result? On an average entry price of 38.00 and an average exit price of 38.32, an 0.84% gain was realized in about 85 minutes. While this kind of intraday gain won't cover the mortgage payment, the fact that it was achieved with so little risk (due to all the technical and multi-time frame confirmations) made it an especially satisfying way to make some trading profits. |
| For those who are unfamiliar with the language of daytrading, the multicolored horizontal lines on the three-minute GDX chart are known as floor trader pivots or pivot points. Long before the era of instant intraday charts, pit traders in Chicago and New York were using this arrangement to help determine the kinds of trade entries that they would pursue for the next day's trading session. They reasoned that if prices stayed above the pivot point, then the trend bias was bullish and that if prices stayed below the pivot point, then the trend bias was bearish. They also determined that various support and resistance levels above and below the pivot point could also offer a framework to help their trading decisions. Given the stressful and chaotic nature of the trading pits, it's easy to understand why such floor traders needed such a simple and objective way to calculate all of these price levels before the session opened. Do they work? Sometimes they do, especially when combined with other forms of technical analysis. For example, recall that on the three-minute GDX chart that after R1 was breached to the upside, it subsequently acted as support on two occasions. At the same time, the widening EMA spread on the 15-minute chart was confirming that the trend bias was up and the very long flagpole on the pennant was also suggesting that a strong move up was likely. Buying the bullish breakout from the pennant was very low risk because of those additional technical confirmations. Floor pivots are good tools, ones that can be turned into a superior trading weapon if deployed with additional technical confirmation. Incidentally, many charting platforms allow you to plot the pivot points on your intraday charts with the push of a button, so make sure you familiarize yourself with this useful and potentially profitable technical tool. |
Donald W. Pendergast is a financial markets consultant who offers specialized services to stock brokers and high net worth individuals who seek a better bottom line for their portfolios.
| Title: | Writer, market consultant |
| Company: | Linear Trading Systems LLC |
| Jacksonville, FL 32217 | |
| Phone # for sales: | 904-239-9564 |
| E-mail address: | lineartradingsys@gmail.com |
Traders' Resource Links | |
| Linear Trading Systems LLC has not added any product or service information to TRADERS' RESOURCE. | |
Click here for more information about our publications!
Comments
Date: 03/30/09Rank: 4Comment:

Request Information From Our Sponsors
- StockCharts.com, Inc.
- Candle Patterns
- Candlestick Charting Explained
- Intermarket Technical Analysis
- John Murphy on Chart Analysis
- John Murphy's Chart Pattern Recognition
- John Murphy's Market Message
- MurphyExplainsMarketAnalysis-Intermarket Analysis
- MurphyExplainsMarketAnalysis-Visual Analysis
- StockCharts.com
- Technical Analysis of the Financial Markets
- The Visual Investor
- VectorVest, Inc.
- Executive Premier Workshop
- One-Day Options Course
- OptionsPro
- Retirement Income Workshop
- Sure-Fire Trading Systems (VectorVest, Inc.)
- Trading as a Business Workshop
- VectorVest 7 EOD
- VectorVest 7 RealTime/IntraDay
- VectorVest AutoTester
- VectorVest Educational Services
- VectorVest OnLine
- VectorVest Options Analyzer
- VectorVest ProGraphics v6.0
- VectorVest ProTrader 7
- VectorVest RealTime Derby Tool
- VectorVest Simulator
- VectorVest Variator
- VectorVest Watchdog
