HOT TOPICS LIST
- MACD
- Fibonacci
- RSI
- Gann
- ADXR
- Stochastics
- Volume
- Triangles
- Futures
- Cycles
- Volatility
- ZIGZAG
- MESA
- Retracement
- Aroon
INDICATORS LIST
LIST OF TOPICS
PRINT THIS ARTICLE
by Koos van der Merwe
Nokia has given a buy signal. The question, of course, is why?
Position: Buy
Koos van der Merwe
Has been a technical analyst since 1969, and has worked as a futures and options trader with First Financial Futures in Johannesburg, South Africa.
PRINT THIS ARTICLE
TREND-CHANNEL
Nokia Gives Buy Signal
03/26/09 10:09:11 AMby Koos van der Merwe
Nokia has given a buy signal. The question, of course, is why?
Position: Buy
| Recently, Nokia (NOK), the world's largest maker of cell phones, announced that it had invested in a mobile payment company. Nokia likes the idea of turning your cell phone into a credit card, and it's putting its money where its mouth is. The company announced that it had bought a minority stake in Obopay, a mobile payment company that allows people to pay for things using their mobile phones. Is this the "Why"? Is this the future trend of mobile phones? Is that bit of plastic, usually more than one that bulks your wallet, something that Nokia intends to make a thing of the past? The market seems to think so and likes the idea. |

|
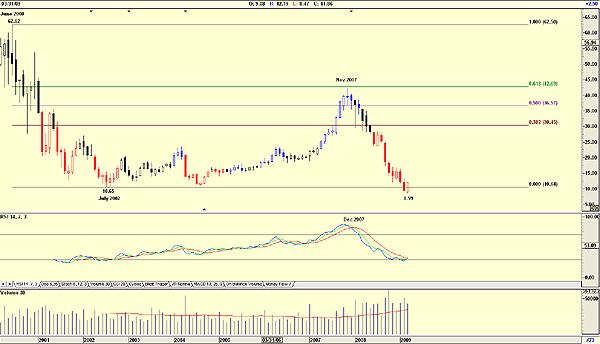
| FIGURE 1: NOK, MONTHLY |
| Graphic provided by: AdvancedGET. |
| |
| Figure 1, a monthly chart of NOK, shows how the price dropped from a high of $62.62 in June 2000, the start of the technology bubble bursting, to the low of $10.65 by July 2002. A Fibonacci retracement shows that the stock price recovered to $42.69, the 61.8% ratio, before falling to its present level of $8.59. The chart also shows how the relative strength index (RSI) gave a buy signal in July 2002, a sell signal in December 2007, and now once again has given a buy signal. Volume increased as the price fell but does appear to be stabilizing at present levels, although it is still well above its average (red line). An increase in volume as the stock price rises is bullish. |

|
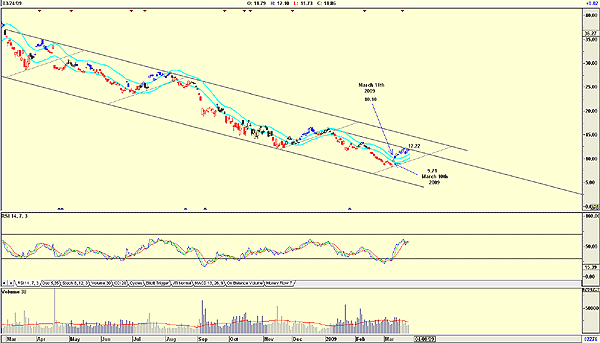
| FIGURE 2: NOK, DAILY |
| Graphic provided by: AdvancedGET. |
| |
| Figure 2 is a daily chart of NOK and shows the following: a. Major and minor trendlines. NOK is testing a minor trendline at 12.22. b. The share price broke above the internal JM moving average band when the price was $10.10 on March 11, 2009. The JM internal moving average band in this instance is a 15-period simple moving average offset by 4%. c. The color of the candlesticks turned from red to blue, suggesting a buy on March 10, 2009, when the price was $9.71. The XTL strategy for identifying buy and sell signals on charts is a proprietary indicator of AdvancedGET. Blue candlesticks suggests strength, red weakness, and black neutral. With the anticipated recovery in the market, and Nokia's recent purchase of a minority stake in Obopay, as well as the buy signals given by the technical indicators, make the stock worth considering. |
Has been a technical analyst since 1969, and has worked as a futures and options trader with First Financial Futures in Johannesburg, South Africa.
| Address: | 3256 West 24th Ave |
| Vancouver, BC | |
| Phone # for sales: | 6042634214 |
| E-mail address: | petroosp@gmail.com |
Click here for more information about our publications!
Comments
Date: 03/30/09Rank: 4Comment:

Request Information From Our Sponsors
- StockCharts.com, Inc.
- Candle Patterns
- Candlestick Charting Explained
- Intermarket Technical Analysis
- John Murphy on Chart Analysis
- John Murphy's Chart Pattern Recognition
- John Murphy's Market Message
- MurphyExplainsMarketAnalysis-Intermarket Analysis
- MurphyExplainsMarketAnalysis-Visual Analysis
- StockCharts.com
- Technical Analysis of the Financial Markets
- The Visual Investor
- VectorVest, Inc.
- Executive Premier Workshop
- One-Day Options Course
- OptionsPro
- Retirement Income Workshop
- Sure-Fire Trading Systems (VectorVest, Inc.)
- Trading as a Business Workshop
- VectorVest 7 EOD
- VectorVest 7 RealTime/IntraDay
- VectorVest AutoTester
- VectorVest Educational Services
- VectorVest OnLine
- VectorVest Options Analyzer
- VectorVest ProGraphics v6.0
- VectorVest ProTrader 7
- VectorVest RealTime Derby Tool
- VectorVest Simulator
- VectorVest Variator
- VectorVest Watchdog
