HOT TOPICS LIST
- MACD
- Fibonacci
- RSI
- Gann
- ADXR
- Stochastics
- Volume
- Triangles
- Futures
- Cycles
- Volatility
- ZIGZAG
- MESA
- Retracement
- Aroon
INDICATORS LIST
LIST OF TOPICS
PRINT THIS ARTICLE
by Ron Walker
A good trader is always looking for clues of a reversal, trying to piece together the technical jigsaw puzzle.
Position: N/A
Ron Walker
Ron Walker is an active trader and technical analyst. He operates an educational website dedicated to the study of Technical Analysis. The website offers free market analysis with daily video presentations and written commentaries. Ron is a video pioneer, being one of the first to utilize the internet producing Technical Analysis videos. His website is thechartpatterntrader.com
PRINT THIS ARTICLE
TECHNICAL ANALYSIS
The Impeccable Timing Of Intraday Charts
03/26/09 11:24:49 AMby Ron Walker
A good trader is always looking for clues of a reversal, trying to piece together the technical jigsaw puzzle.
Position: N/A
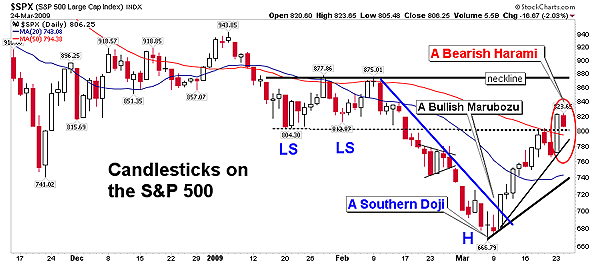
| A good trader is always looking for clues of a reversal, trying to piece together the technical jigsaw puzzle. Recently I wrote an article for traders.com entitled "Breaking Ranks With The Bears," which featured a bullish reversal on the Standard & Poor's 500 with reference to the daily charts. Now I would like to address the impeccable timing that the intraday charts can offer in determine potential reversals. If you are going to swing trade you have to have mobility, and the intraday charts display reversal signals early enough to prepare for a potential reversal and to profit from it. Not all intraday reversals pan out, but their predictive powers are strong and can help keep us on the right side of a trade. The S&P 500 has come along way off the momentum low of 666 made on March 6, rising approximately 23.5% to its current peak of 823. That is a gain of 157 points. In Figure 1, we see that a bullish marubozu candlestick broke the minor trendline that staged a powerful rally that carried the S&P 500 above both the 10- and 20-day simple moving averages. The advance was so strong that prices broke above the major overhead resistance at 804 on March 23 with a long white candle, which moved in tandem with the trend. However, the next day prices traded in a narrow range, with a small real body, that stayed within the real body of the previous day. This is called an inside day, but the two-day candle pattern is called a bearish harami and could be showing that the trend is weakening. This pattern must be confirmed by a close below the low of the pattern in order to have validity. In this case, the harami pattern would be confirmed with a close below the low of the first day at 772. At that point, the pattern would evolve into a bearish three inside down pattern. The harami's follow-through not only confirms the reversal but strengthens it. But remember that the rising trend is still intact, which could bring about a false signal, so until the harami is confirmed the trend is still up. |

|
| FIGURE 1: $SPX, DAILY. If the 795 rising minor trendline is taken out by the 15-minute traders, then the hourly traders may attempt to sweep prices back to the 20-day SMA, which converges near the rising trend from the 666 momentum low. If prices reach 875, the S&P 500 could be setting up an inverse head & shoulders pattern. |
| Graphic provided by: StockCharts.com. |
| |
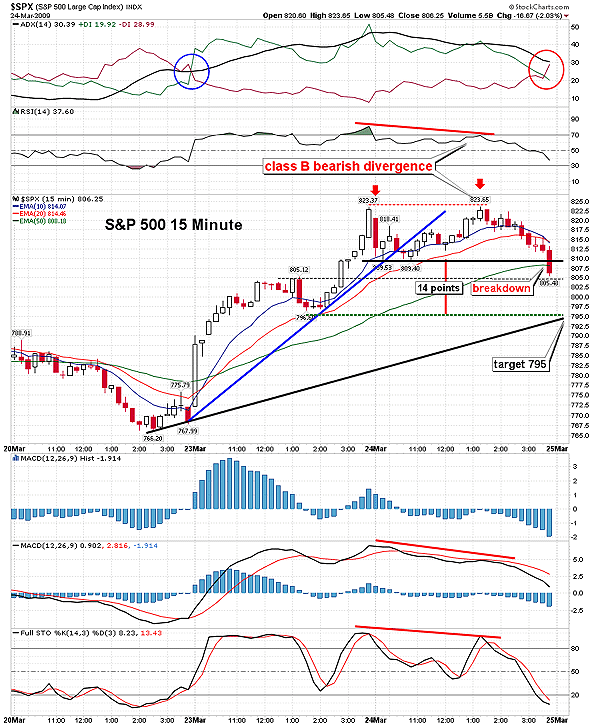
| The intraday charts may give us some clues as to whether the harami reversal pattern has any chance of playing out. In Figure 2, the 15-minute chart of the S&P 500 peaked at 823, then turned and broke through an accelerated minor trendline. But prices found support at the last minor low of 809. After bouncing off support, the advance resumed diagonally, climbing back up to test the previous minor high at 823. It was then that a bearish class B divergence formed, which means that prices matched their previous high, while the indicator of choice -- the relative strength index (RSI) (14) -- formed a lower peak. Thus, prices collapsed under the burden of resistance, as a double top pattern formed with a bearish divergence hovering over the 15-minute minute chart. Bogged down by resistance, the S&P 500 began to deteriorate and, by the end of the session on March 24, broke down below the 809 confirmation line, validating a small double top pattern on the 15-minute chart. |

|
| FIGURE 2: $SPX, 15-MINUTE. Note that the direction movement indicator got a bearish cross hat coincided with the breakdown of the double-top pattern. The 10- and 20-day EMAs are now beginning to roll over, pointing to the way toward the 15-minute trend. Horizontal and rising support intersect at 795, where the prevous minor low resides on March 23. |
| Graphic provided by: StockCharts.com. |
| |
| The pattern measures 14 points (by subtracting the lowest point of the pattern from the highest point of the pattern), giving it an objective target of 795. There is horizontal support near 795, with the last minor low at 796. Moreover, the rising trendline of the 766 low intersects with horizontal support at 795. So if the pattern runs its course, the S&P 500 may get a short-term bounce at 795. However, any bounce would likely be short-lived, amounting in a lower high forming. If a lower high occurs, it will launch a war between the bulls and bears for the 795 territory. Should the bears be victorious, the winds of adversity will penetrate below the 795 level of support en route toward confirming the bearish harami pattern on the daily chart at 772. |

|
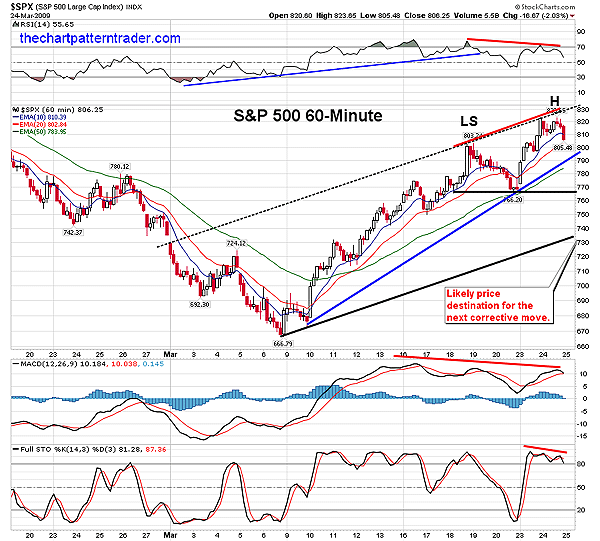
| FIGURE 3: $SPX, HOURLY. Should prices penetrate through the rising minor trendline at or near 795, the next level of support is 766, which could be the neckline for a head & shoulders topping pattern. Note the divergence on the RSI with the price chart while the MACD is rolling over. If prices retreat to the 740 area, a new channel rising price channel will have formed. |
| Graphic provided by: StockCharts.com. |
| |
| In Figure 3, we can see the bigger picture on the hourly chart of the S&P 500, and the prospects of a new rising price channel. Note that the rising trendline we observed at 766 on the 15-minute chart actually extends all the way back to the first higher low that occurred after the March 6th reversal. If this minor trendline is fractured at 795, then the forces of gravity will take over, as prices fall back to land on support at 766. So the double top pattern on the 15-minute chart could put the S&P 500 hourly chart on the fast track to setting up a head & shoulder topping pattern. The double-top pattern on the 15-minute could be carving out the right side of the head on the hourly chart. If prices bounce off the 766 level of support a right shoulder could emerge, one that will ultimately result in a corrective move that could take the S&P 500 down to test the rising trendline set by the 666 low made on March 6. That trendline could be pointing to the next low. Incidentally, that trendline is hovering near the 20-day simple moving average (SMA) on the daily chart (Figure 1). The 20-day SMA is like a magnet; prices never stray to far away from it and are always eventually drawn back to it. So that could be a potential area where the next correction might be contained. |
| We may see a resurgence of the bears, which are moving on multiple fronts against the bulls in the 60-minute time frame (Figure 3) with a bearish divergence on the relative strength index (RSI) (14), while the moving average convergence/divergence (MACD)(12, 26, 9) is poised to roll over and the stochastic (14, 3, 3) remains overbought. These bearish signals have a high provability of influencing short-term direction to the downside. We don't know for sure if the bearish harami will be confirmed on the daily chart, but the intraday charts show that some bearish sentiment is beginning to creep back into the market. There is a high chance of a reversal given the state of the intraday charts, tilting things in favor of the bears for the short term. By integrating multiple time frames, we can gain perspective on potential reversals. Intraday charts act as a magnifying glass, showing the potential strength or weakness of advance or decline. Given the many bullish signals on the S&P 500 daily and weekly charts (not shown) and the bearish signals on the intraday charts, my analysis leads me to conclude that the S&P 500 could conceivably have a correction at this time. Despite a corrective move, we have ample evidence on the daily and weekly charts that once it has concluded, prices should resume the price progression toward the next key level of resistance at 875 (Figure 1), putting in a higher low on the S&P 500 daily chart. Prices could stall at 875, which is a potential neckline for an inverse head & shoulders pattern. |
Ron Walker is an active trader and technical analyst. He operates an educational website dedicated to the study of Technical Analysis. The website offers free market analysis with daily video presentations and written commentaries. Ron is a video pioneer, being one of the first to utilize the internet producing Technical Analysis videos. His website is thechartpatterntrader.com
| Website: | thechartpatterntrader.com |
| E-mail address: | thechartpatterntrader@gmail.com |
Click here for more information about our publications!
Comments
Date: 03/30/09Rank: 4Comment:
Date: 03/30/09Rank: 4Comment:

Request Information From Our Sponsors
- StockCharts.com, Inc.
- Candle Patterns
- Candlestick Charting Explained
- Intermarket Technical Analysis
- John Murphy on Chart Analysis
- John Murphy's Chart Pattern Recognition
- John Murphy's Market Message
- MurphyExplainsMarketAnalysis-Intermarket Analysis
- MurphyExplainsMarketAnalysis-Visual Analysis
- StockCharts.com
- Technical Analysis of the Financial Markets
- The Visual Investor
- VectorVest, Inc.
- Executive Premier Workshop
- One-Day Options Course
- OptionsPro
- Retirement Income Workshop
- Sure-Fire Trading Systems (VectorVest, Inc.)
- Trading as a Business Workshop
- VectorVest 7 EOD
- VectorVest 7 RealTime/IntraDay
- VectorVest AutoTester
- VectorVest Educational Services
- VectorVest OnLine
- VectorVest Options Analyzer
- VectorVest ProGraphics v6.0
- VectorVest ProTrader 7
- VectorVest RealTime Derby Tool
- VectorVest Simulator
- VectorVest Variator
- VectorVest Watchdog
