HOT TOPICS LIST
- MACD
- Fibonacci
- RSI
- Gann
- ADXR
- Stochastics
- Volume
- Triangles
- Futures
- Cycles
- Volatility
- ZIGZAG
- MESA
- Retracement
- Aroon
INDICATORS LIST
LIST OF TOPICS
PRINT THIS ARTICLE
by Donald W. Pendergast, Jr.
It's been a wild ride for the silver market since 2003, but the charts now appear to point toward the possibility of further gains this year.
Position: Accumulate
Donald W. Pendergast, Jr.
Donald W. Pendergast is a financial markets consultant who offers specialized services to stock brokers and high net worth individuals who seek a better bottom line for their portfolios.
PRINT THIS ARTICLE
SWING CHART
SLV Bullish On Both Daily And Weekly Charts
03/25/09 09:00:42 AMby Donald W. Pendergast, Jr.
It's been a wild ride for the silver market since 2003, but the charts now appear to point toward the possibility of further gains this year.
Position: Accumulate
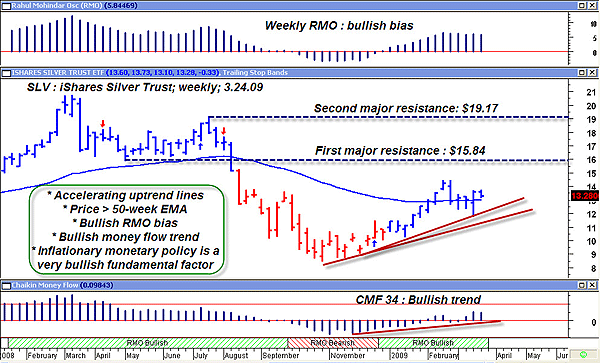
| Silver, often referred to as "the poor man's gold," has made dramatic moves up and down over the past generation. Those old enough to remember the chronic consumer price inflation that ravaged the US from the late 1960s into the early 1980s are also old enough to recall the astounding price moves in the silver market from 1974 to 1980 when it went from $2 an ounce all the way to $52 an ounce. It was hardly a surprise to see renewed interest in this precious metal earlier in this decade, given the ever-expanding money supply, multitrillion-dollar budget deficits and continually shrinking rate of silver mine production. Prices went from about $4 in 2001 all the way up to $21 a year ago, but given the bullish fundamental and technical factors concerning the silver market, some metals analysts see prices eventually able to meet or even exceed the highs set back in 1980. The weekly chart of SLV, the exchange traded fund that tracks the silver market, is our first stop in Figure 1. |

|
| FIGURE 1: SLV, WEEKLY. Based on a variety of fundamental and technical factors, this weekly bull trend in the silver market appears to be gathering strength. |
| Graphic provided by: MetaStock. |
| |
| From all appearances, the weekly graph of SLV is maintaining a very bullish posture. The combination of accelerating uptrend lines, a bullish Rahul Mohindar oscillator (RMO) bias, bullish Chaikin money flow (CMF)(34) trend and the crossing above the 50-week exponential moving average (EMA) all give credence to the fact that money, and lots of it, is beginning to pour back into the commodity markets in anticipation of substantially higher prices in the months and years to come. On the fundamental side, silver mining production has been struggling to keep up with increased global investment and industrial demand even as governments around the globe print money like mad in hopes of reinflating the global economy. Such a combination of factors is rare, but here they are, and they have the potential to drive the price of silver substantially higher. Let's look at SLV's daily chart in Figure 2 and see if we can zero in on an investment and/or trading opportunity. |

|
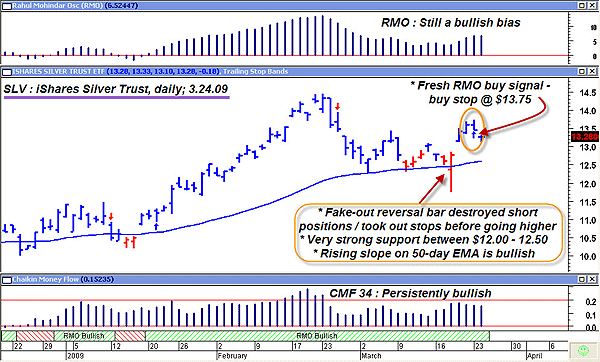
| FIGURE 2: SLV, DAILY. A picture is worth a thousand words; the reversal/fakeout bar, followed by a gap higher and a fresh RMO swing buy signal, all combined to reveal the deep and abiding bullish bias of this particular market. |
| Graphic provided by: MetaStock. |
| |
| A similarly bullish theme presents itself, but this time it's on the daily chart. Just as in the higher time frame, both the RMO and money flow indicators are persistently bullish, the trend is rising, and price is well above one of the key moving averages that define intermediate-length trends, the 50-period EMA. In addition, the reversal fakeout bar, one designed to lure short-sellers into a position and/or to take out long sell-stops, certainly did its job well. Check out the intraday range that resulted as short-sellers panicked, covering their short positions in a hurry. Right after that fakeout bar, price gapped higher, confirming the strong bullish bias of this market. Right now, price is consolidating, pulling back a bit toward the open gap and the RMO swing trade arrow just fired a long entry signal, one that will be validated on a move up to $13.75. If that price gets hit within the next few sessions, it would be no surprise to see silver to catch a fresh bid and start to crank higher, possibly moving up toward February's high at $14.40. Since there is such heavy support near $12.50 and also near the open gap ($12.86–13.12), this swing trade entry is a relatively low risk proposition. Savvy traders might want to take half profits near $14.40 (if a bullish continuation move develops after entry at $13.75) and then trail the remainder with a three-bar trailing stop of the lows. |
| Longer-term investors may want to acquire some actual physical silver as an inflation hedge; if you adjust today's silver price of $13.28 into 1979 dollars, silver is only selling for about $3.00 an ounce. As you recall, silver went from about $9.00 in August 1979 to $52 in January 1980 (yes, it moved that far in only five and a half months!), back when the consumer price index hit 12% and Treasury bills were paying almost 14%. Could such a move happen again? It seems unlikely, but consider the fact that investor sentiment (better known as "mass fear") was the primary factor that propelled both silver and gold higher back then, and if today's damaged financial system becomes vulnerable to uncontrollable bouts of consumer price inflation, it's not hard to imagine millions of frightened investors rushing to the perceived safety of gold and silver. The precious metals markets are relatively tiny in dollar terms compared to the Treasury bond, stock and forex markets, so a tidal wave of scared money seeking refuge in gold and silver metals could result in rapid, violent price spikes. So trade the moves in the gold and silver market, basing your entries and exits on rational technical criteria that offer a solid risk-reward ratio. But for long-term financial protection, it might be wise to maintain at least a portion of your liquid net worth in real gold and silver, holding on to them until some sort of sanity is restored to the global financial order. Given the sad state of world affairs, we may need to hold on to our gold and silver for a very long time indeed. |
Donald W. Pendergast is a financial markets consultant who offers specialized services to stock brokers and high net worth individuals who seek a better bottom line for their portfolios.
| Title: | Writer, market consultant |
| Company: | Linear Trading Systems LLC |
| Jacksonville, FL 32217 | |
| Phone # for sales: | 904-239-9564 |
| E-mail address: | lineartradingsys@gmail.com |
Traders' Resource Links | |
| Linear Trading Systems LLC has not added any product or service information to TRADERS' RESOURCE. | |
Click here for more information about our publications!
Comments
Date: 03/25/09Rank: 5Comment:

Request Information From Our Sponsors
- StockCharts.com, Inc.
- Candle Patterns
- Candlestick Charting Explained
- Intermarket Technical Analysis
- John Murphy on Chart Analysis
- John Murphy's Chart Pattern Recognition
- John Murphy's Market Message
- MurphyExplainsMarketAnalysis-Intermarket Analysis
- MurphyExplainsMarketAnalysis-Visual Analysis
- StockCharts.com
- Technical Analysis of the Financial Markets
- The Visual Investor
- VectorVest, Inc.
- Executive Premier Workshop
- One-Day Options Course
- OptionsPro
- Retirement Income Workshop
- Sure-Fire Trading Systems (VectorVest, Inc.)
- Trading as a Business Workshop
- VectorVest 7 EOD
- VectorVest 7 RealTime/IntraDay
- VectorVest AutoTester
- VectorVest Educational Services
- VectorVest OnLine
- VectorVest Options Analyzer
- VectorVest ProGraphics v6.0
- VectorVest ProTrader 7
- VectorVest RealTime Derby Tool
- VectorVest Simulator
- VectorVest Variator
- VectorVest Watchdog
