HOT TOPICS LIST
- MACD
- Fibonacci
- RSI
- Gann
- ADXR
- Stochastics
- Volume
- Triangles
- Futures
- Cycles
- Volatility
- ZIGZAG
- MESA
- Retracement
- Aroon
INDICATORS LIST
LIST OF TOPICS
PRINT THIS ARTICLE
by David Penn
With the S&P Paper/Forest Products sector index coming off of a three-year low, more than a few paper products companies are having excellent years.
Position: N/A
David Penn
Technical Writer for Technical Analysis of STOCKS & COMMODITIES magazine, Working-Money.com, and Traders.com Advantage.
PRINT THIS ARTICLE
TECHNICAL ANALYSIS
Power to the Paper
08/21/01 04:20:47 PMby David Penn
With the S&P Paper/Forest Products sector index coming off of a three-year low, more than a few paper products companies are having excellent years.
Position: N/A
| One of the interesting things about technical analysis is the ability to spot a trend in a particular industry or market sector, even without knowing a single reason why that particular industry or market sector is in the kind of trend it is in. For example, the fact that the S&P Gold and Precious Metals index has been rising this year could be considered a defensive move in the face of declines in the stock market. On the other hand, the rally in Paper/Forest Products stocks seems much less explicable. |
| Nevertheless the rally is in effect, as a quick scan of a number of paper products companies--from International Paper to Stuffit Stone Container--attests. A number of these companies' stocks are retesting intermediate highs set earlier in the year and, should the stronger stocks successfully retest and make new highs, more gains across the sector are certainly possible. |

|
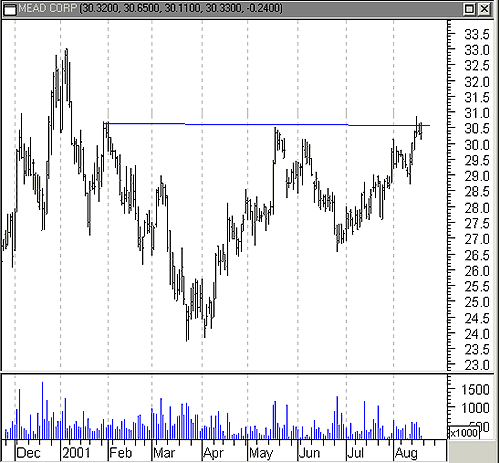
| The third test of resistance at 30.5 comes as this cup with handle formation is set up for an upside breakout. |
| Graphic provided by: MetaStock. |
| |
| One formation that often appears when stocks are retesting highs is the cup-with-handle formation. While this formation can appear at the beginning or end of a trend, as well as in the middle as a form of continuation, when appearing at the end of an uptrend, the cup-with-handle formation can yield bullish interpretations. When in this position, the left lip of the cup often represents the new high. The top of the cup comes as prices correct from the new high. The roundedness of the correction--as opposed to a more sharp, V-shaped correction--is a sign of the moderation of the correction, and suggests that any upside move will have a more stable price pattern as a foundation. |
| The right lip of the cup formation represents the first attempt to test the new high. The correction that follows an unsuccessful attempt here is much shallower than the previous correction. This price action is described as "the handle," and the failure of prices to retrace deeply is another bullish sign. The resistance area formed by a horizontal line drawn from the left lip to the right lip is the area prices need to penetrate when rallying from the correction reflected in "the handle." |
| In the case of Mead Corporation (MEA) we note a cup with handle inside a cup-with-handle. The larger cup has a left lip at the end of January, a cup "body" that bottoms late in March, and a right lip in mid-May. The handle "body" bottoms in late June and the upside breakout looks to be develoing in mid-August. This larger cup has a formation size of about six, which anticipates a 20% breakout possibility of as high as 34 (formation size added to the value at the breakout point). The smaller cup's left lip begins where the larger cup's right lip begins. A right lip for the smaller cup exists at the top of the late July rally, with the smaller handle coming in the form of the two-week correction and rally in August. Interestingly, the formation size of the smaller cup is three, which added to the breakout point gives a compatible upside target of 33. |
Technical Writer for Technical Analysis of STOCKS & COMMODITIES magazine, Working-Money.com, and Traders.com Advantage.
| Title: | Technical Writer |
| Company: | Technical Analysis, Inc. |
| Address: | 4757 California Avenue SW |
| Seattle, WA 98116 | |
| Phone # for sales: | 206 938 0570 |
| Fax: | 206 938 1307 |
| Website: | www.Traders.com |
| E-mail address: | DPenn@traders.com |
Traders' Resource Links | |
| Charting the Stock Market: The Wyckoff Method -- Books | |
| Working-Money.com -- Online Trading Services | |
| Traders.com Advantage -- Online Trading Services | |
| Technical Analysis of Stocks & Commodities -- Publications and Newsletters | |
| Working Money, at Working-Money.com -- Publications and Newsletters | |
| Traders.com Advantage -- Publications and Newsletters | |
| Professional Traders Starter Kit -- Software | |
Click here for more information about our publications!
Comments

Request Information From Our Sponsors
- StockCharts.com, Inc.
- Candle Patterns
- Candlestick Charting Explained
- Intermarket Technical Analysis
- John Murphy on Chart Analysis
- John Murphy's Chart Pattern Recognition
- John Murphy's Market Message
- MurphyExplainsMarketAnalysis-Intermarket Analysis
- MurphyExplainsMarketAnalysis-Visual Analysis
- StockCharts.com
- Technical Analysis of the Financial Markets
- The Visual Investor
- VectorVest, Inc.
- Executive Premier Workshop
- One-Day Options Course
- OptionsPro
- Retirement Income Workshop
- Sure-Fire Trading Systems (VectorVest, Inc.)
- Trading as a Business Workshop
- VectorVest 7 EOD
- VectorVest 7 RealTime/IntraDay
- VectorVest AutoTester
- VectorVest Educational Services
- VectorVest OnLine
- VectorVest Options Analyzer
- VectorVest ProGraphics v6.0
- VectorVest ProTrader 7
- VectorVest RealTime Derby Tool
- VectorVest Simulator
- VectorVest Variator
- VectorVest Watchdog
